Strategic Management
Strategy, decisions, and the bigger picture.
Before you start
Syllabus-checked revision — 29 questions with answers
The core set remains Q1–Q25. Additional answers Q26–Q29 below deepen the syllabus topics that needed more explanation. Expand the syllabus checklist at the end to locate each topic.
Based on the supplied MIM702A Strategic Management syllabus. Module weightings: M1 15%, M2 20%, M3 15%, M4 25%, M5 25%. Give Modules 4 and 5 proportionate revision time.
How to use: Expand one question at a time. Smaller overlapping questions have been folded into the relevant answer. For a short answer, use the definition and key points; for a longer answer, add the explanation, diagram or worked example. These are syllabus-based study groups, not predictions of the exam paper.
Module 1: Strategic Management Overview — 15%
Q1. Define strategy and strategic management. Explain the features of strategic management.
Introduction
Every organisation must decide where it wants to go and how it will get there in a changing, competitive world. Strategy is that long-term plan, and strategic management is the continuous process of creating, carrying out and reviewing it.
1. Meaning of Strategy
- Alfred Chandler (1962): strategy is "the determination of the basic long-term goals and objectives of an enterprise, and the adoption of courses of action and the allocation of resources necessary for carrying out these goals".
- William Glueck: strategy is "a unified, comprehensive and integrated plan designed to assure that the basic objectives of the enterprise are achieved".
- Henry Mintzberg's 5 Ps: strategy can be seen as a Plan, a Ploy (a move to outwit a rival), a Pattern (consistent behaviour), a Position (place in the market) and a Perspective (the firm's way of seeing the world).
2. Meaning of Strategic Management
Fred David defines strategic management as "the art and science of formulating, implementing and evaluating cross-functional decisions that enable an organisation to achieve its objectives".
3. Features of Strategic Management
- Long-term orientation: looks 3–10 years ahead.
- Top-management responsibility: decided at the highest level.
- Environment-focused: matches the firm with external opportunities and threats.
- Holistic and cross-functional: links production, marketing, finance and HR.
- Involves major resource commitment and is hard to reverse.
- Continuous and dynamic: strategy is reviewed as conditions change.
- Aims at competitive advantage and long-term survival.
- Future-oriented and uncertain: based on forecasts and judgement.
Advantages:
- Gives clear direction and focus.
- Helps the firm anticipate change.
- Improves use of resources.
Limitations:
- Time-consuming and costly.
- Future is uncertain, so plans may fail.
- May become rigid if not reviewed.
Comparison Table
| Basis | Strategy | Strategic management |
|---|---|---|
| Meaning | A long-term plan | The process of forming, implementing and evaluating that plan |
| Nature | An output | A continuous process |
| Example | "Become the lowest-cost telecom provider" | Scanning, planning, executing and reviewing that plan |
Example: Reliance Jio entered telecom in 2016 with very low data prices and a nationwide 4G network – a clear long-term strategy of winning market share through low cost and scale.
Memory aid: Mintzberg's 5 Ps – Plan, Ploy, Pattern, Position, Perspective.
Scope and importance: Strategic management integrates corporate, business and functional decisions. It sets direction, allocates scarce resources, anticipates environmental change, coordinates departments and builds competitive advantage. Strategy gives the overall direction; policy guides recurring decisions; tactics are specific actions used to execute strategy.
Q2. Explain vision, mission, goals and objectives. Distinguish between them.
Introduction
Before choosing a strategy, a firm must know what it wants to become and why it exists. Vision, mission, goals and objectives form a hierarchy of intent, moving from a broad dream to specific, measurable targets.
Diagram loads when you reach it.
Diagram text
flowchart TD
    V["VISION<br/>what we want to become – broad, inspiring"] --> M["MISSION<br/>why we exist – purpose, business, customers"]
    M --> G["GOALS<br/>broad results to achieve"]
    G --> O["OBJECTIVES<br/>specific, measurable, time-bound targets"]
1. Vision
A vision is a statement of what the organisation wants to become in the long-term future. It is inspiring and aspirational.
- Features: future-oriented, short, clear, inspiring, stable.
- Example: an electric-vehicle start-up's vision – "To make clean mobility affordable for every Indian family."
2. Mission
A mission states the organisation's purpose – why it exists, what business it is in, who its customers are and what value it provides.
- Components: customers, products/services, markets, technology, concern for survival and growth, philosophy, self-concept, public image, concern for employees.
- Example: "We provide affordable, reliable electric two-wheelers and charging services to urban and semi-urban customers."
3. Goals
Goals are broad, general results the organisation wants to achieve, usually not precisely measured. Example: "Become a market leader in electric two-wheelers."
4. Objectives
Objectives are specific, measurable targets that convert goals into action. Good objectives are SMART – Specific, Measurable, Achievable, Relevant, Time-bound. Example: "Sell 1 lakh scooters and achieve 15% market share by March 2028."
Comparison Table
| Basis | Vision | Mission | Goals | Objectives |
|---|---|---|---|---|
| Question answered | What do we want to become? | Why do we exist? | What broad results? | What exact targets? |
| Time frame | Very long | Long | Medium to long | Short to medium |
| Nature | Inspirational | Purpose-based | General | Specific, measurable |
| Measurable? | No | No | Partly | Yes |
Memory aid: V-M-G-O – "Very Many Good Outcomes" – broad to specific.
Strategic intent and SMART: Strategic intent expresses a long-term ambition. Objectives translate that ambition into targets that are specific, measurable, achievable, relevant and time-bound.
Q3. Explain the levels at which strategy operates.
Introduction
In a large organisation, strategic decisions are made at different levels – for the whole company, for each business and for each department. The three levels of strategy are corporate-level, business-level and functional-level strategy.
Diagram loads when you reach it.
Diagram text
flowchart TD
    C["CORPORATE LEVEL (Board, CEO)<br/>'Which businesses should we be in?'"] --> B1["BUSINESS LEVEL (SBU 1)<br/>'How do we compete here?'"]
    C --> B2["BUSINESS LEVEL (SBU 2)<br/>'How do we compete here?'"]
    B1 --> F["FUNCTIONAL LEVEL<br/>Production · Marketing · Finance · HR<br/>'How does each department support it?'"]
    B2 --> F
1. Corporate-Level Strategy
Decides the overall scope of the organisation – which industries and markets to be in, and how to allocate resources among businesses.
- Made by: board of directors and top management.
- Types: stability, growth/expansion (diversification, integration, mergers), retrenchment (turnaround, divestment) and combination strategies.
- Example: the Tata Group deciding to enter or exit industries such as airlines, retail or semiconductors.
2. Business-Level Strategy
Decides how a business unit (SBU) will compete in its particular industry.
- Made by: SBU or division heads.
- Types: Porter's generic strategies – cost leadership, differentiation and focus.
- Example: a budget airline competing on low fares.
3. Functional-Level Strategy
Decides how each department supports the business strategy.
- Made by: functional managers.
- Types: production, marketing, financial, HR, R&D strategies.
- Example: the marketing department running digital campaigns to support a low-cost positioning.
Comparison Table
| Basis | Corporate | Business | Functional |
|---|---|---|---|
| Key question | Which businesses? | How to compete? | How to support? |
| Decided by | Board, CEO | SBU heads | Department heads |
| Time frame | Long | Medium | Short |
| Scope | Whole company | One business | One function |
| Example | Diversify into retail | Cost leadership | Lean production |
Q4. What is strategic decision making? Explain its characteristics and modes.
Introduction
Strategic decisions are major, long-term decisions that shape the future of the whole organisation – such as entering a new market, acquiring a company or launching a new product line. Strategic decision making is the process of identifying, evaluating and choosing such decisions.
1. Characteristics of Strategic Decisions
- Rare and non-routine: made infrequently.
- Consequential: commit large resources.
- Long-term: affect the firm for many years.
- Directive: set the framework for lesser decisions.
- Taken by top management.
- Made under uncertainty and risk.
- Hard to reverse.
2. Modes of Strategic Decision Making (Mintzberg)
- Entrepreneurial mode: one powerful person (often the founder) makes bold decisions focused on opportunities. Example: a start-up founder decides to expand abroad.
- Adaptive mode: reactive, step-by-step solutions to current problems rather than proactive search for opportunities; common in large, established firms.
- Planning mode: systematic gathering of information and analysis of alternatives by experts; both proactive and reactive.
- Logical incrementalism (added by Quinn): a mix of planning and adaptive modes – a broad vision is set, then strategy is developed gradually through experiments and learning.
3. Steps in Strategic Decision Making
- Evaluate current performance.
- Review corporate governance (board and top management).
- Scan the external environment.
- Scan the internal environment.
- Analyse strategic factors (SWOT).
- Generate and evaluate alternatives.
- Implement the selected strategy.
- Evaluate and control.
Comparison Table
| Mode | Who decides | Nature | Suits |
|---|---|---|---|
| Entrepreneurial | Founder / one leader | Bold, opportunity-seeking | Young, small firms |
| Adaptive | Managers | Reactive, small steps | Stable, large firms |
| Planning | Experts, analysts | Systematic, analytical | Complex, large firms |
| Logical incrementalism | Top management | Vision plus gradual learning | Uncertain environments |
Example: When an IT company decides whether to acquire an AI start-up, top management studies the market, compares alternatives and then decides – the planning mode.
Q5. Explain the process of strategic management with a diagram.
Introduction
Strategic management is not a one-time act but a continuous cycle. According to Wheelen and Hunger, it has four basic elements – environmental scanning, strategy formulation, strategy implementation, and evaluation and control – preceded by setting the vision and mission.
Diagram:
Diagram loads when you reach it.
Diagram text
flowchart LR
    A["1. Vision, mission<br/>and objectives"] --> B["2. Environmental<br/>scanning"] --> C["3. Strategy<br/>formulation"] --> D["4. Strategy<br/>implementation"] --> E["5. Evaluation<br/>and control"]
    E -. "feedback / learning" .-> A
Stages of the Process
- Setting vision, mission and objectives: defines what the firm wants to become, why it exists and what it must achieve.
- Environmental scanning: analysing the external environment (opportunities and threats – PESTLE, Porter's Five Forces) and the internal environment (strengths and weaknesses – value chain, resources). SWOT summarises the results.
- Strategy formulation: developing and choosing strategies at corporate, business and functional levels (growth, cost leadership, differentiation, etc.).
- Strategy implementation: putting strategy into action through structure, budgets, programmes, procedures, leadership, culture and change management.
- Evaluation and control: comparing actual performance with objectives, finding deviations and taking corrective action.
- Feedback: results from evaluation feed back into every earlier stage.
Comparison Table
| Stage | Key question | Tools |
|---|---|---|
| Vision and mission | Where do we want to go? | Vision/mission statements |
| Scanning | What is happening around and within us? | PESTLE, Five Forces, SWOT |
| Formulation | What should we do? | BCG, generic strategies |
| Implementation | How do we do it? | Structure, leadership, culture |
| Evaluation | Did it work? | Balanced scorecard, budgets |
Example: A dairy co-operative scans rising demand for protein products (scanning), decides to launch high-protein curd (formulation), sets up a new production line and campaign (implementation) and tracks sales against targets (evaluation).
Memory aid: "Very Smart Firms Implement Everything" – Vision, Scanning, Formulation, Implementation, Evaluation.
Module 2: Strategy Formulation — 20%
Q6. Explain environmental scanning using internal/external analysis, SWOT and PESTLE.
Introduction
A firm cannot choose a good strategy without knowing what is happening around it and within it. Environmental scanning is the monitoring, evaluating and disseminating of information from the external and internal environments to key people in the organisation, so that opportunities, threats, strengths and weaknesses can be identified.
1. External Environmental Analysis
Studies factors outside the firm that it cannot control; the aim is to find opportunities and threats.
- Macro (general) environment: political, economic, social, technological, legal and ecological factors – analysed with PESTLE.
- Micro (task / industry) environment: customers, competitors, suppliers, substitutes, new entrants – analysed with Porter's Five Forces.
2. Internal Environmental Analysis
Studies factors inside the firm that it can control; the aim is to find strengths and weaknesses.
- Resources: financial, physical, human, technological, brand.
- Capabilities and core competencies: what the firm does especially well.
- Functional areas: marketing, production, finance, HR, R&D.
- Tools: value chain analysis, resource audit, McKinsey 7S, financial ratio analysis.
3. Techniques of Environmental Scanning
- ETOP (Environmental Threat and Opportunity Profile): lists environmental factors and their impact on the firm.
- SAP (Strategic Advantage Profile): summarises the firm's internal strengths and weaknesses.
- SWOT analysis: combines internal and external findings.
- Scenario planning: imagining several possible futures.
- Forecasting, surveys, competitor intelligence.
Advantages:
- Early warning of threats.
- Identifies new opportunities.
- Gives a factual basis for strategy.
Limitations:
- Information may be incomplete or costly.
- The environment changes quickly.
Comparison Table
| Basis | External analysis | Internal analysis |
|---|---|---|
| Focus | Outside the firm | Inside the firm |
| Control | Uncontrollable | Controllable |
| Identifies | Opportunities, threats | Strengths, weaknesses |
| Tools | PESTLE, Five Forces, ETOP | Value chain, 7S, SAP |
Example: An electric-scooter maker scans government EV subsidies (opportunity), rising lithium prices (threat), its strong R&D team (strength) and weak service network (weakness).
SWOT and PESTLE — revise here rather than as separate answers:
| Tool | Elements | Use |
|---|---|---|
| SWOT | Internal strengths and weaknesses; external opportunities and threats | Match organisational capabilities to the environment |
| PESTLE | Political, economic, social, technological, legal and environmental factors | Scan the macro-environment |
For a small online retailer: efficient delivery can be a strength, limited funds a weakness, growing online demand an opportunity and strong competition a threat. PESTLE examines policy, purchasing power, shopping habits, technology, legal duties and sustainability. Competitor analysis examines rivals' objectives, strategies, resources, strengths and likely responses.
Q7. Explain Porter's Five Forces model of competition analysis.
Introduction
Michael Porter (1979) argued that the profitability of an industry depends not only on direct rivals but on five competitive forces. Analysing these forces shows how attractive an industry is and where the firm should position itself.
Diagram:
Diagram loads when you reach it.
Diagram text
flowchart TD
    NE["THREAT OF NEW ENTRANTS"] --> R["RIVALRY AMONG<br/>EXISTING COMPETITORS"]
    SP["BARGAINING POWER<br/>OF SUPPLIERS"] --> R
    BP["BARGAINING POWER<br/>OF BUYERS"] --> R
    TS["THREAT OF SUBSTITUTES"] --> R
The Five Forces
- Threat of new entrants: high when entry barriers are low. Barriers include economies of scale, capital requirements, brand loyalty, access to distribution, government licences.
- Bargaining power of suppliers: high when there are few suppliers, unique inputs or high switching costs.
- Bargaining power of buyers: high when buyers are few and large, products are standard, and switching is easy.
- Threat of substitute products: high when other products meet the same need at a good price (tea vs coffee; video calls vs air travel).
- Rivalry among existing competitors: intense when there are many equal-sized rivals, slow industry growth, high fixed costs and low differentiation.
Advantages:
- Shows industry attractiveness and profit potential.
- Helps find where to position the firm.
- Useful before entering a new industry.
Limitations:
- Static; ignores fast changes.
- Ignores cooperation and complements.
- Less suited to digital, network-based industries.
Comparison Table (Indian telecom example)
| Force | Level | Reason |
|---|---|---|
| New entrants | Low | Huge spectrum and network costs |
| Supplier power | Medium | Few equipment makers |
| Buyer power | High | Easy number portability, price-sensitive users |
| Substitutes | Medium | Wi-Fi and internet calling apps |
| Rivalry | High | Few big players fighting on price |
Memory aid: "New Suppliers Buy Substitute Rivals" – New entrants, Suppliers, Buyers, Substitutes, Rivalry.
Q8. Explain generic strategies and sources of competitive advantage.
Introduction
After analysing the industry, a firm must decide how to compete. Michael Porter (1980) proposed three generic (business-level) strategies to achieve competitive advantage: cost leadership, differentiation and focus.
Diagram:
| Competitive scope ↓ / Advantage → | Lower cost | Differentiation |
| Broad target | 1. Cost leadership | 2. Differentiation |
| Narrow target | 3A. Cost focus | 3B. Differentiation focus |
1. Cost Leadership
Becoming the lowest-cost producer in a broad market and offering low prices or earning higher margins.
- Sources: economies of scale, efficient processes, cheap inputs, simple products.
- Risks: rivals copy, technology change, quality falls.
- Example: D-Mart's everyday-low-price model.
2. Differentiation
Offering a unique product or service that customers value and will pay more for, in a broad market.
- Sources: quality, design, brand, technology, service.
- Risks: high cost, imitation, customers may not value the uniqueness.
- Example: Apple's design and ecosystem.
3. Focus
Serving a narrow segment (a region, customer group or niche) better than broad competitors.
- Cost focus: lowest cost within the niche (budget hostels for students).
- Differentiation focus: unique offering for the niche (luxury sports cars).
Stuck in the middle: a firm that tries to do everything without a clear strategy usually earns below-average profits.
Comparison Table
| Basis | Cost leadership | Differentiation | Focus |
|---|---|---|---|
| Target | Broad market | Broad market | Narrow segment |
| Advantage | Low cost | Uniqueness | Specialisation |
| Price | Low | Premium | Low or premium |
| Example | D-Mart | Apple | Rolex, budget hostels |
Competitive advantage: An advantage arises when a firm creates superior customer value or delivers comparable value at lower cost. Sources include efficient processes, distinctive skills, innovation, brand reputation, distribution and service. The advantage must be difficult to imitate and supported by the firm's resources.
Q9. Explain value chain analysis with a diagram.
Introduction
To find where its competitive advantage comes from, a firm must look at every activity it performs. Value chain analysis, introduced by Michael Porter (1985), divides a firm into primary and support activities that create value for customers. The difference between the value created and the cost of creating it is the margin.
Diagram:
| Activity type | Activities |
|---|---|
| Support activities | Firm infrastructure (management, finance, legal) · Human resource management · Technology development (R&D, IT) · Procurement (purchasing inputs) |
| Primary activities | Inbound logistics → Operations → Outbound logistics → Marketing and sales → Service |
| Result | MARGIN = value created for customers minus the cost of all activities |
1. Primary Activities
- Inbound logistics: receiving, storing and handling inputs (raw materials, inventory).
- Operations: converting inputs into finished products (manufacturing, assembly, packaging).
- Outbound logistics: storing and distributing finished goods to buyers.
- Marketing and sales: advertising, pricing, selling, channel management.
- Service: installation, repair, training, customer support after sale.
2. Support Activities
- Firm infrastructure: general management, planning, finance, legal, quality systems.
- Human resource management: recruitment, training, appraisal, pay.
- Technology development: R&D, process improvement, IT systems.
- Procurement: purchasing raw materials, machines and services.
3. Steps in Value Chain Analysis
- Identify each activity.
- Find the cost and value added by each activity.
- Compare with competitors.
- Find sources of cost advantage or differentiation.
- Improve weak activities or outsource them.
Advantages:
- Shows exactly where value and cost arise.
- Helps achieve cost leadership or differentiation.
- Supports outsourcing decisions.
Limitations:
- Built for manufacturing; harder to apply to services.
- Cost data for each activity may be hard to get.
Comparison Table
| Type | Activities | Example (online retailer) |
|---|---|---|
| Primary | Inbound, operations, outbound, marketing, service | Warehousing, packing, fast delivery, app ads, easy returns |
| Support | Infrastructure, HRM, technology, procurement | Finance team, delivery staff training, recommendation AI, supplier contracts |
Example: An online grocery firm gains advantage through fast outbound logistics (delivery in minutes) supported by technology development (route-planning software).
Memory aid: Primary – "I Only Order My Shoes" (Inbound, Operations, Outbound, Marketing, Service); Support – "FHTP" (Firm infrastructure, HRM, Technology, Procurement).
Q10. Explain McKinsey's 7S framework.
Introduction
A good strategy fails if the rest of the organisation does not support it. The McKinsey 7S framework, developed around 1980 by Tom Peters and Robert Waterman (with Richard Pascale and Anthony Athos) at McKinsey & Company, says that seven interrelated elements must be aligned for an organisation to be effective.
Diagram:
Diagram loads when you reach it.
Diagram text
flowchart TD
    SV(("SHARED<br/>VALUES"))
    ST["STRATEGY"] --- SV
    STR["STRUCTURE"] --- SV
    SYS["SYSTEMS"] --- SV
    STY["STYLE"] --- SV
    STF["STAFF"] --- SV
    SK["SKILLS"] --- SV
    ST --- STR
    STR --- SYS
    SYS --- STY
    STY --- STF
    STF --- SK
    SK --- ST
1. Hard Elements (easier to define and change)
- Strategy: the plan to build competitive advantage.
- Structure: how the organisation is arranged – hierarchy, reporting lines, departments.
- Systems: daily procedures and processes – IT, budgeting, HR and quality systems.
2. Soft Elements (harder to define, shaped by culture)
- Shared values: core values and beliefs at the centre of the model (also called superordinate goals).
- Style: the leadership and management style of top managers.
- Staff: the people, their number and types.
- Skills: the distinctive capabilities of employees and the organisation.
3. Uses of the 7S Framework
- Checking whether a new strategy fits the organisation.
- Planning mergers and restructuring.
- Diagnosing performance problems.
- Managing organisational change.
Advantages:
- Considers both hard and soft factors.
- Shows that all elements are linked.
- Useful for change management.
Limitations:
- Qualitative; hard to measure.
- Ignores external factors.
- Changing one element affects all others, making it complex.
Comparison Table
| Hard S | Soft S |
|---|---|
| Strategy | Shared values |
| Structure | Style |
| Systems | Staff |
| – | Skills |
| Easy to change | Hard to change |
Example: When a traditional bank moves to digital banking (strategy), it must also change systems (mobile apps), skills (digital training), staff (hire tech experts), style (faster decisions) and shared values (customer-first).
Memory aid: Hard: "3 S" – Strategy, Structure, Systems; Soft: "SSSS" – Shared values, Style, Staff, Skills.
Q11. Explain the Balanced Scorecard.
Introduction
Financial results alone show past performance but not future potential. The Balanced Scorecard (BSC), developed by Robert Kaplan and David Norton (1992), is a strategic performance-measurement tool that looks at the organisation from four balanced perspectives, linking strategy to measurable objectives.
Diagram:
Diagram loads when you reach it.
Diagram text
flowchart TD
    F["FINANCIAL<br/>'How do we look to shareholders?'"] --- V(("VISION AND<br/>STRATEGY"))
    C["CUSTOMER<br/>'How do customers see us?'"] --- V
    I["INTERNAL PROCESS<br/>'What must we excel at?'"] --- V
    L["LEARNING AND GROWTH<br/>'Can we continue to improve?'"] --- V
The Four Perspectives
- Financial perspective: "How do we look to shareholders?" Measures – profit, revenue growth, return on investment, cash flow.
- Customer perspective: "How do customers see us?" Measures – customer satisfaction, retention, market share, complaints.
- Internal business process perspective: "What must we excel at?" Measures – quality, cycle time, productivity, defect rate.
- Learning and growth perspective: "Can we continue to improve and create value?" Measures – employee skills, training hours, innovation, IT capability, employee satisfaction.
Steps in Using a Balanced Scorecard
- Translate vision and strategy into objectives for each perspective.
- Set measures (KPIs) and targets.
- Plan initiatives to achieve targets.
- Communicate the scorecard across the organisation.
- Review results and learn.
Advantages:
- Balances financial and non-financial measures.
- Links daily work to strategy.
- Includes leading indicators of future performance.
Limitations:
- Choosing the right measures is difficult.
- Can become too complex with many KPIs.
- Needs strong top-management commitment.
Comparison Table (example for a hospital)
| Perspective | Objective | Measure | Target |
|---|---|---|---|
| Financial | Improve profitability | Operating margin | 12% |
| Customer | Satisfied patients | Patient satisfaction score | 90% |
| Internal process | Faster service | Average waiting time | Under 20 minutes |
| Learning and growth | Skilled staff | Training hours per nurse | 40 per year |
Memory aid: "FCIL" – Financial, Customer, Internal process, Learning and growth.
Q12. Explain the BCG matrix with a diagram.
Introduction
A company with many businesses or products must decide where to invest and where to withdraw. The BCG (Boston Consulting Group) growth–share matrix, developed by Bruce Henderson in about 1970, is a portfolio analysis tool that classifies business units by market growth rate and relative market share.
Diagram:
| Market growth ↓ / Relative market share → | High share | Low share |
| High growth | ★ STARS (invest to grow) | ? QUESTION MARKS (build or divest) |
| Low growth | \$ CASH COWS (hold, milk cash) | ✗ DOGS (harvest or divest) |
1. The Four Quadrants
- Stars (high growth, high share): market leaders in fast-growing markets; earn a lot but also need heavy investment. Strategy: invest to build and hold leadership.
- Cash cows (low growth, high share): leaders in mature markets; generate more cash than they need. Strategy: hold, and use the cash to fund stars and question marks.
- Question marks / problem children (high growth, low share): in attractive markets but weak position; need large cash to grow. Strategy: build selectively or divest.
- Dogs (low growth, low share): weak position in slow markets; earn little. Strategy: harvest or divest.
2. Four Strategies Suggested
- Build: increase market share (question marks, stars).
- Hold: maintain share (cash cows).
- Harvest: take short-term cash, cut investment (weak cash cows, dogs).
- Divest: sell or close the unit (dogs, weak question marks).
Typical life cycle: Question mark → Star → Cash cow → Dog.
Advantages:
- Simple and visual.
- Helps allocate resources across a portfolio.
- Shows the balance of cash generation and use.
Limitations:
- Uses only two factors.
- Market share is not the only source of profit.
- "Dogs" may still be useful (support other products).
- Defining the market is difficult.
Comparison Table
| Quadrant | Growth | Share | Cash flow | Strategy |
|---|---|---|---|---|
| Star | High | High | Uses and earns a lot | Build / hold |
| Cash cow | Low | High | Generates surplus | Hold / milk |
| Question mark | High | Low | Needs cash | Build or divest |
| Dog | Low | Low | Low | Harvest / divest |
Example: A consumer-goods company may treat its leading toothpaste brand in a mature market as a cash cow and use its profits to grow a new organic-food line (a question mark).
Module 3: Strategy Implementation — 15%
Q13. Explain implementation, organisational structure and common implementation problems.
Introduction
A brilliant strategy is useless if it stays on paper. Strategy implementation is the process of putting the chosen strategy into action through structure, resources, programmes, budgets, procedures, leadership and culture. It is often called the "action stage" of strategic management.
1. Steps in Strategy Implementation
- Develop programmes: activities needed to carry out the strategy (a new product launch, an IT upgrade).
- Prepare budgets: allocate money and resources to each programme.
- Set procedures: step-by-step methods for routine work.
- Design the organisational structure to fit the strategy.
- Staff and train the right people.
- Lead and motivate: provide direction and build commitment.
- Build a supportive culture.
- Set up information and control systems to track progress.
2. Requirements for Successful Implementation
- Clear communication of the strategy.
- Commitment of top management.
- Adequate resources.
- Fit between strategy, structure and culture.
- Proper rewards and incentives.
Comparison Table
| Basis | Strategy formulation | Strategy implementation |
|---|---|---|
| Meaning | Deciding what to do | Doing it |
| Nature | Thinking, analytical | Action, operational |
| Focus | Effectiveness (right things) | Efficiency (doing things right) |
| Skills needed | Analysis, intuition | Motivation, leadership, coordination |
| People involved | Top management | Managers and employees at all levels |
| Example | Decide to expand into rural India | Set up rural distributors, train staff, launch small packs |
Example: A bank decides to go digital (formulation) and then builds a mobile app, trains branch staff and changes processes (implementation).
Structure and implementation issues: Functional structures suit specialisation; divisional structures separate products or regions; matrix structures combine reporting dimensions. Structure should support strategy through suitable authority, coordination and accountability. Common barriers are unclear goals, weak communication, inadequate resources, resistance, poor coordination and incentives that reward the wrong behaviour.
Q14. How is strategic change managed? Explain Lewin's model and resistance to change.
Introduction
Implementing a new strategy usually requires changes in structure, technology, processes and behaviour. Managing strategic change means planning and guiding these changes so that people accept them and the organisation moves smoothly to its new state.
1. Lewin's Three-Step Model (Kurt Lewin)
Diagram loads when you reach it.
Diagram text
flowchart LR
U["UNFREEZE<br/>prepare for change"] --> C["CHANGE (MOVE)<br/>introduce new ways of working"] --> R["REFREEZE<br/>make the new ways permanent"]- Unfreezing: create awareness that change is needed; reduce resistance by explaining reasons.
- Changing (moving): introduce new strategies, structures, systems and behaviour; provide training and support.
- Refreezing: make the new behaviour permanent through rewards, policies and culture.
2. Kotter's Eight Steps (John Kotter, 1996)
- Establish a sense of urgency.
- Create a guiding coalition.
- Develop a vision and strategy.
- Communicate the change vision.
- Empower broad-based action.
- Generate short-term wins.
- Consolidate gains and produce more change.
- Anchor new approaches in the culture.
3. Reasons for Resistance to Change
- Fear of the unknown.
- Fear of losing jobs, status or power.
- Habit and comfort with existing ways.
- Lack of trust in management.
- Poor communication.
- Group pressure.
4. Overcoming Resistance (Kotter and Schlesinger)
- Education and communication.
- Participation and involvement.
- Facilitation and support (training, counselling).
- Negotiation and agreement.
- Manipulation and co-optation (use carefully).
- Explicit and implicit coercion (last resort).
Comparison Table
| Lewin stage | Key action | Example (introducing ERP software) |
|---|---|---|
| Unfreeze | Explain the need | Show delays caused by manual records |
| Change | Train and implement | Install ERP, train staff |
| Refreeze | Reinforce | Reward use, retire old system |
Example: When a manufacturer automates its plant, it explains the need, retrains workers for new roles and rewards adoption, reducing fear of job loss.
Memory aid: "Ice cube" model – melt (unfreeze), reshape (change), freeze again (refreeze).
Q15. Explain the role of leadership and corporate culture.
Introduction
Strategy is implemented by people, and people need direction. Strategic leadership is the ability to anticipate, envision, maintain flexibility and empower others to create strategic change. Leaders turn strategy into action by inspiring and guiding the organisation.
1. Roles of Leadership in Strategy Implementation
- Setting direction: communicating a clear vision and strategy.
- Building commitment: inspiring employees to accept and support the strategy.
- Designing structure and systems that support the strategy.
- Allocating resources to strategic priorities.
- Shaping corporate culture through values and personal example.
- Managing change and resistance.
- Developing people: selecting, training and empowering managers.
- Ensuring ethical behaviour.
- Monitoring progress and taking corrective action.
2. Leadership Styles and Strategy
- Transformational leadership: inspires major change through vision and charisma – suits turnaround or innovation strategies.
- Transactional leadership: uses rewards and penalties for meeting targets – suits stable, efficiency strategies.
- Participative leadership: involves employees in decisions – builds commitment.
- Autocratic leadership: quick decisions in a crisis.
Comparison Table
| Style | Approach | Best suited to |
|---|---|---|
| Transformational | Vision, inspiration | Turnaround, innovation |
| Transactional | Rewards for targets | Stable operations |
| Participative | Involvement | Change needing commitment |
| Autocratic | Command | Crisis |
Example: Satya Nadella's leadership at Microsoft from 2014 shifted the company's culture towards learning and collaboration and its strategy towards cloud computing.
Corporate culture: Shared values, beliefs and norms influence everyday decisions. A strategy requiring innovation needs experimentation and learning, while a safety-critical operation needs disciplined procedures. Leaders model the required behaviour and align recruitment, training, incentives and communication with the strategy. A strong culture helps only when it fits the strategic direction.
How culture supports implementation: Identify current norms, compare them with the behaviours the strategy needs, retain supportive practices, and address conflicts through leadership example, hiring, socialisation, training and incentives. Symbols and slogans are insufficient if actual rewards contradict the strategy. For example, a customer-service strategy needs employees to be rewarded for resolving issues, not merely ending calls quickly. Review staff feedback and service outcomes to see whether behaviours have changed.
Q16. Explain CSR and ethics in strategic management.
Introduction
Businesses use society's resources and affect many stakeholders, so they are expected to act responsibly. Corporate Social Responsibility (CSR) is a company's commitment to operate ethically and contribute to economic development while improving the quality of life of employees, the community and society.
1. Carroll's Pyramid of CSR (Archie Carroll, 1991)
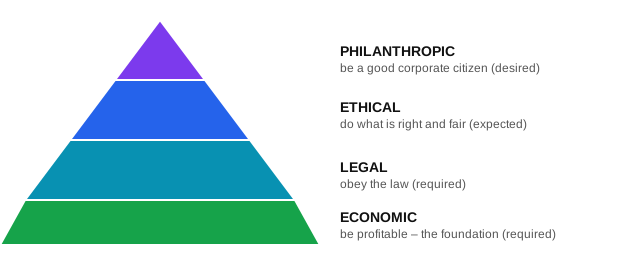
- Economic responsibility: produce goods and earn profits.
- Legal responsibility: obey laws and regulations.
- Ethical responsibility: be fair and just beyond the law.
- Philanthropic responsibility: contribute to community welfare.
2. Responsibilities Towards Stakeholders
- Shareholders: fair return, transparency.
- Employees: fair wages, safety, development.
- Customers: safe, quality products, fair prices, honest ads.
- Government: pay taxes, follow laws.
- Community and environment: reduce pollution, support local development.
Advantages of CSR:
- Improves brand image and trust.
- Attracts and retains employees.
- Builds long-term sustainability.
Limitations:
- Costs reduce short-term profits.
- Risk of "greenwashing" (CSR only for publicity).
Comparison Table
| Level (Carroll) | Expectation | Example |
|---|---|---|
| Economic | Be profitable | Earn profits, create jobs |
| Legal | Obey the law | Follow pollution norms |
| Ethical | Be fair | Honest advertising |
| Philanthropic | Give back | Fund village schools |
Example: Many large Indian companies fund education, healthcare and rural development projects under Section 135.
Ethics: Ethical strategy uses honesty, fairness, transparency and accountability in decisions affecting customers, employees, suppliers, investors and society. Use codes of conduct, leadership example, reporting channels and consistent enforcement. Legal compliance alone does not settle every ethical issue.
Applying ethics to a strategic decision: Identify affected stakeholders, check facts and obligations, consider fairness and potential harm, compare alternatives, explain the decision and establish accountability. Manage conflicts of interest, misleading claims, improper inducements and misuse of information through policies and consistent enforcement. CSR concerns responsibilities and impacts on society; ethics concerns the rightness of the methods and decisions used to achieve objectives. A donation does not excuse harmful business practices.
Module 4: Strategy Evaluation and Control — 25%
Q17. Explain the purpose, design and implementation of strategic control.
Introduction
A strategic control system is a formal system of targets, measures, monitoring and feedback that helps top management check whether strategy is achieving its objectives. Designing it involves a sequence of steps, similar to the basic control process.
Diagram:
Diagram loads when you reach it.
Diagram text
flowchart LR
    A["1. Decide what<br/>to measure"] --> B["2. Set<br/>standards"] --> C["3. Measure actual<br/>performance"] --> D["4. Compare with<br/>standards"] --> E["5. Take corrective<br/>action"]
    E -. feedback .-> A
Steps in Designing a Strategic Control System
- Decide what to measure: identify key result areas linked to strategy – profitability, market share, customer satisfaction, innovation, productivity.
- Set standards of performance: specific targets or Key Performance Indicators (KPIs), with tolerance limits.
- Measure actual performance: collect timely, accurate data through reports, audits and information systems.
- Compare actual performance with standards: find deviations and analyse their causes (internal problem or environmental change).
- Take corrective action: improve implementation, change resources, revise standards or even change the strategy.
- Feedback: results feed into the next planning cycle.
Features of a Good Strategic Control System
- Linked to strategy and key success factors.
- Uses both financial and non-financial measures.
- Timely and cost-effective.
- Flexible enough to change with the environment.
- Focuses on significant deviations (management by exception).
- Understandable and accepted by managers.
Comparison Table
| Step | Example (retail chain) |
|---|---|
| What to measure | Same-store sales growth |
| Standard | 8% growth per year |
| Actual | 5% growth |
| Deviation | 3% shortfall due to new online rival |
| Corrective action | Launch home delivery and loyalty app |
Purpose and implementation: Evaluation checks whether strategy remains suitable and is achieving objectives. Assign owners, set standards and review intervals, collect reliable data, compare results, investigate deviations, take corrective action and follow up. Feedback can require a change in execution or in the strategy itself.
Q18. Explain the types of strategic control.
Introduction
Because strategies are based on assumptions about an uncertain future, firms need special types of control beyond normal operational checks. Schreyögg and Steinmann (1987) identified four types of strategic control: premise control, implementation control, strategic surveillance and special alert control.
1. Premise Control
Checks whether the assumptions (premises) on which the strategy is based are still valid.
- Premises checked: environmental factors (inflation, technology, regulation) and industry factors (competitors, suppliers, substitutes).
- Example: a car company's EV strategy assumed government subsidies would continue; premise control checks whether they still exist.
2. Implementation Control
Checks whether the strategy is being implemented as planned and still makes sense as events unfold.
- Monitoring strategic thrusts: tracking key projects or programmes.
- Milestone reviews: reviewing the strategy at major milestones (a launch, the end of a phase, a budget point).
- Example: reviewing a new plant's progress after construction is complete.
3. Strategic Surveillance
A broad, unfocused monitoring of internal and external events that may affect the strategy – a general "radar" for anything unexpected.
- Sources: news, trade journals, conferences, social media, industry reports.
- Example: noticing a start-up's new technology that could disrupt the industry.
4. Special Alert Control
A rapid, thorough reconsideration of strategy after a sudden, unexpected event.
- Events: natural disasters, pandemics, product recalls, major regulatory changes, takeover bids.
- Tools: crisis teams and contingency plans.
- Example: firms rapidly shifting to remote work and online sales during the COVID-19 lockdowns.
Operational control (supporting): budgets, schedules and KPIs that monitor day-to-day performance.
Comparison Table
| Type | Focus | Nature | Example |
|---|---|---|---|
| Premise control | Assumptions | Focused | Are subsidies still available? |
| Implementation control | Execution steps | Focused | Milestone review of a new plant |
| Strategic surveillance | General environment | Unfocused | Watching for disruptive technology |
| Special alert control | Sudden events | Crisis-driven | Pandemic response |
Memory aid: "Please Implement Smart Safeguards" – Premise, Implementation, Surveillance, Special alert.
Q19. Explain operational, marketing, financial and HR issues in strategic control.
Introduction
Functional issues are the problems and decisions within each functional area that affect strategy. Operational (production) issues concern how efficiently the firm converts inputs into goods and services; they strongly influence cost, quality and delivery.
1. Key Operational/Production Issues
- Capacity planning: having the right production capacity – too little loses sales, too much raises costs.
- Location and layout: plant location (near markets or raw materials) and efficient layout.
- Technology and automation: choice of machines, automation level, upgrading.
- Quality management: consistent quality through TQM, Six Sigma, ISO standards.
- Inventory management: balancing stock levels – Just-in-Time (JIT), economic order quantity.
- Supply chain and sourcing: reliable suppliers, make-or-buy decisions, logistics.
- Productivity and cost control: output per worker or machine, waste reduction (lean production).
- Maintenance and safety.
2. Control Measures for Operations
- Production schedules and output targets.
- Quality control charts, defect rates.
- Inventory turnover ratio.
- Capacity utilisation percentage.
- Cost per unit and productivity ratios.
- On-time delivery rate.
Comparison Table
| Issue | Strategic link | Control measure |
|---|---|---|
| Capacity | Meets demand growth | Capacity utilisation % |
| Quality | Supports differentiation | Defect rate |
| Inventory | Reduces cost | Inventory turnover |
| Technology | Efficiency, innovation | Productivity per worker |
| Supply chain | Reliability | On-time delivery % |
Example: A two-wheeler maker following cost leadership controls cost per unit, inventory levels and defect rates every month.
Compare all four functional control areas:
| Area | Issues to review | Example measures |
|---|---|---|
| Operations / production | Capacity, quality, cost, inventory, delivery and productivity | Defect rate, unit cost, delivery reliability |
| Marketing | Segmentation, positioning, product, pricing, promotion, channels and customer response | Sales, market share, retention, campaign performance |
| Finance | Profitability, liquidity, funding, cash flow, investment and budget discipline | Margins, cash flow, ROI, budget variance |
| Human resources | Skills, staffing, motivation, training, appraisal and culture | Turnover, absenteeism, productivity, training effectiveness |
Use strategic objectives to choose measures; a single favourable indicator does not prove the strategy is successful.
Q20. Explain the environmental factors and information required for strategic control.
Introduction
Strategic control is not only internal; the strategy must stay in line with a changing external environment. Effective control also depends on accurate, timely information reaching decision-makers.
1. Environmental Factors in Strategic Control
- Economic changes: inflation, interest rates, recession.
- Technological change: new technologies that make products obsolete.
- Political and legal changes: new laws, taxes, regulations.
- Social changes: shifting customer tastes and lifestyles.
- Competitive changes: new entrants, price wars.
- Ecological factors: pollution norms, climate risk, sustainability expectations, waste and carbon regulations.
These are monitored through premise control, strategic surveillance and special alert control (Q18).
2. Information Needed for Strategic Control
- Internal information: sales, costs, production, quality, HR and financial data.
- External information: market trends, competitor moves, customer feedback, government policy.
- Qualities of good information: accurate, timely, relevant, complete, concise and cost-effective.
3. Information Systems for Strategic Control
- Management Information System (MIS): regular reports for managers.
- Decision Support System (DSS): models and analysis for semi-structured decisions.
- Executive Information System (EIS) / dashboards: summarised key indicators for top management.
- Enterprise Resource Planning (ERP): integrates data from all departments.
- Business intelligence and analytics tools.
Comparison Table
| Information type | Source | Use in control |
|---|---|---|
| Internal | ERP, accounts, HR records | Measure actual performance |
| External | Market research, news, competitors | Check premises, spot threats |
| Summarised | Dashboards / EIS | Quick review by top management |
Example: A cement company's dashboard shows daily sales, fuel costs and new pollution rules, allowing management to react quickly.
Q21. Explain the techniques of strategic evaluation and control.
Introduction
Managers use several techniques to evaluate whether strategy is working and to control performance. These can be grouped into techniques for strategic control (checking the strategy itself) and operational control (checking performance against plans).
1. Techniques for Evaluating Strategy
- Rumelt's criteria: tests strategy for consistency, consonance, advantage and feasibility.
- Strategic momentum control: checks whether the basic assumptions still hold – includes responsibility control centres, use of critical success factors and generic strategies.
- Strategic leap control: for fast-changing environments – includes strategic issue management, scenario planning, systems modelling and strategic field analysis.
- SWOT review and benchmarking against competitors or best practices.
2. Techniques for Operational Control
- Budgets and budgetary control: compare actual income and spending with plans.
- Ratio analysis and financial statements.
- Balanced Scorecard: financial, customer, process and learning measures.
- Management by Objectives (MBO): managers and subordinates agree on objectives and review results.
- Benchmarking: comparing processes with the best in the industry.
- Key Performance Indicators (KPIs) and dashboards.
- Network techniques (PERT/CPM): control project time and cost.
- Management and strategic audits: independent review of strategy and management.
- Gap analysis: compares desired and actual performance.
- Variance analysis and standard costing.
Advantages:
- Give objective evidence of performance.
- Combine financial and non-financial views.
Limitations:
- Too many measures can confuse.
- Some strategic results are hard to quantify.
Comparison Table
| Technique | What it controls | Example |
|---|---|---|
| Budgets | Spending and revenue | Marketing budget vs actual |
| Balanced Scorecard | Four perspectives | Hospital scorecard |
| Benchmarking | Process efficiency | Compare delivery time with leader |
| PERT/CPM | Project schedules | New plant construction |
| Strategic audit | Whole strategy | Annual board review |
| MBO | Individual objectives | Sales manager targets |
Example: A retail chain uses budgets for each store, benchmarks delivery times against a market leader and reviews a Balanced Scorecard every quarter.
Rumelt's supporting criteria: Consistency asks whether goals and policies agree; consonance checks fit with the environment; feasibility checks resources and capabilities; advantage checks whether the strategy creates or sustains a competitive position.
Module 5: Business Policies — 25%
Q22. Explain business policies, their importance, and policy–procedure–rule distinctions.
Introduction
In any organisation, managers take thousands of decisions every day. If each manager decided in their own way, there would be confusion and inconsistency. Business policies provide standing guidelines so that decisions are made in a consistent way that supports the organisation's objectives.
1. Definitions of Business Policy
- Koontz and O'Donnell: "Policies are general statements or understandings which guide or channel thinking in decision making of subordinates."
- Simple meaning: a business policy is a guide to thinking and action that sets the limits within which managers can make decisions.
- As a subject (discipline): business policy is also the study of the functions and responsibilities of top management and the problems affecting the success of the whole enterprise. It is the older name for the field that developed into strategic management.
2. Overview – Nature and Characteristics of Business Policies
- Guide to decision making: gives a framework, not a fixed answer.
- Allows discretion: managers use judgement within the limits.
- Linked to objectives: helps achieve organisational goals.
- Standing plan: used repeatedly for recurring situations.
- Exists at all levels: corporate, departmental and functional.
- Can be written or implied.
- Should be flexible and reviewed as conditions change.
3. Business Policy and Strategy
- Strategy decides what major actions to take to achieve objectives.
- Policy guides how decisions are made while carrying out strategy.
- Policies are tools for implementing strategy consistently.
Comparison Table
| Basis | Business policy | Strategy |
|---|---|---|
| Meaning | Guide to decision making | Plan of action to achieve objectives |
| Nature | Standing, repetitive | Situational, changes with environment |
| Focus | Consistency of decisions | Competitive position |
| Level | All levels | Mainly top level |
| Example | "Promote from within where possible" | "Expand into international markets" |
Example: A company's policy that "all purchases above ₹5 lakh need three quotations" guides purchase managers in every buying decision.
Importance and distinctions: Policies provide consistency, coordination, faster decisions, delegation and control. A policy is a guiding principle that permits some judgement; a procedure specifies a sequence of steps; a rule states a specific required or prohibited action. Example: a customer-friendly returns policy, the steps for processing a return, and a rule requiring proof of purchase.
Q23. Explain the types of business policies.
Introduction
Policies differ by where they come from, at which level they apply and which function they cover. Understanding the types of business policies helps managers frame complete and suitable policies.
1. On the Basis of Source (Origin)
- Originated policies: developed by top management to guide subordinates. Example: a company's pricing policy.
- Appealed policies: arise when subordinates appeal to higher authorities for guidance on unusual cases; the decision becomes a precedent.
- Implied policies: not written but understood from the behaviour of managers. Example: preference for promoting long-serving staff.
- Externally imposed policies: forced by outside agencies such as government, courts or trade unions. Example: minimum wage or pollution-control policies.
2. On the Basis of Level / Scope
- Basic (major) policies: broad, long-term, set by top management for the whole firm.
- General (secondary) policies: for middle management, covering important areas.
- Departmental (minor) policies: detailed, for day-to-day departmental decisions.
3. On the Basis of Function
- Production policies: make or buy, quality standards, inventory levels.
- Marketing policies: product, pricing, distribution, promotion, credit to customers.
- Financial policies: capital structure, dividends, working capital, investments.
- Personnel (HR) policies: recruitment, training, promotion, wages, welfare.
- Purchase policies: supplier selection, quantity, timing.
- R&D policies: areas and budget for research.
4. On the Basis of Form
- Written policies: recorded in manuals; clear and consistent.
- Unwritten (implied) policies: understood through practice; flexible but may be misunderstood.
Comparison Table
| Basis | Types | Example |
|---|---|---|
| Source | Originated, appealed, implied, externally imposed | Minimum-wage compliance (imposed) |
| Level | Basic, general, departmental | Diversification policy (basic) |
| Function | Production, marketing, finance, HR, purchase, R&D | Dividend policy (finance) |
| Form | Written, unwritten | HR manual (written) |
Memory aid (by source): "OAIE" – Originated, Appealed, Implied, Externally imposed.
Q24. What factors are considered before framing business policies? Explain the essentials of a good policy.
Introduction
A policy will be effective only if it is framed after careful thought about the organisation and its environment. The factors considered before framing policies ensure that the policy is realistic, acceptable and useful.
1. Factors Considered Before Framing Policies
- Organisational objectives: the policy must help achieve them.
- Strategy: it should support the chosen strategy.
- Internal resources and capabilities: finance, people, technology.
- External environment: economic, legal, social, technological and competitive conditions.
- Legal requirements: laws and government regulations.
- Stakeholder interests: employees, customers, shareholders, community.
- Organisational culture and values.
- Past experience and existing policies.
- Ethical and social responsibility considerations.
- Cost and practicality of implementation.
2. Essentials (Characteristics) of a Good Policy
- Clear and definite: easy to understand.
- Written: avoids misunderstanding.
- Consistent: with objectives and with other policies.
- Flexible: allows adjustment to new situations.
- Comprehensive: covers the likely situations.
- Based on facts: not on guesswork.
- Fair and reasonable to all stakeholders.
- Legal and ethical.
- Communicated to everyone concerned.
- Periodically reviewed.
Comparison Table
| Factor | Question to ask | Example |
|---|---|---|
| Objectives | Does it help our goals? | Expansion goal → liberal credit policy |
| Resources | Can we afford it? | Training budget for HR policy |
| Law | Is it legal? | Labour laws for leave policy |
| Stakeholders | Is it fair? | Customer refund policy |
| Culture | Will people accept it? | Work-from-home policy |
Example: Before framing a work-from-home policy, a firm considers productivity goals, IT resources, data-security laws, employee needs and its culture.
Q25. Explain the procedure (process) and steps involved in framing business policies.
Introduction
Framing a business policy is a systematic process, not a casual decision. The process of policy formulation moves from recognising the need for a policy to implementing and reviewing it.
Diagram:
Diagram loads when you reach it.
Diagram text
flowchart TD
    A["1. Identify need / problem"] --> B["2. Define objectives of the policy"]
    B --> C["3. Collect and analyse information"]
    C --> D["4. Develop alternative policies"]
    D --> E["5. Evaluate alternatives"]
    E --> F["6. Select and approve the policy<br/>(put in writing)"]
    F --> G["7. Communicate the policy"]
    G --> H["8. Implement the policy"]
    H --> I["9. Review, evaluate and revise"]
    I -. feedback .-> A
Steps in Framing Business Policies
- Identify the need or problem: recurring situations that need a standard approach (frequent customer complaints about refunds).
- Define the objectives the policy should achieve.
- Collect and analyse information about internal conditions, the environment, laws and stakeholder views.
- Develop alternative policies that could solve the problem.
- Evaluate alternatives for cost, feasibility, legality, fairness and fit with objectives.
- Select and approve the policy; state it clearly in writing; get approval from top management or the board.
- Communicate the policy through manuals, circulars, training and the intranet.
- Implement the policy with supporting procedures and rules.
- Review and revise the policy regularly based on feedback and changing conditions.
Advantages of a Systematic Process:
- Produces well-thought-out, acceptable policies.
- Reduces errors and conflicts.
Limitations:
- Takes time.
- May become bureaucratic if over-formalised.
Comparison Table
| Step | Example (customer refund policy) |
|---|---|
| Identify need | Many complaints about refunds |
| Objectives | Fair, quick refunds; customer trust |
| Information | Consumer law, competitor practices, costs |
| Alternatives | 7-day, 15-day or 30-day return window |
| Evaluate and select | 15-day window chosen |
| Communicate | Website, bills, staff training |
| Implement | Refund procedure set up |
| Review | Check complaints after six months |
Memory aid: "I Do Collect All Evidence, Select, Communicate, Implement, Review" – the nine steps in order.
Additional answers for syllabus depth
These expand topics that were too brief in the condensed set. Existing question numbers are unchanged.
Q26. Explain SWOT analysis with an example.
Introduction
SWOT analysis is a simple but powerful tool that summarises a firm's internal Strengths and Weaknesses and its external Opportunities and Threats. It helps match the firm's capabilities with the environment to choose suitable strategies.
Diagram:
| Helpful | Harmful | |
| Internal | S – Strengths | W – Weaknesses |
| External | O – Opportunities | T – Threats |
1. Components of SWOT
- Strengths (internal, helpful): resources and capabilities that give an advantage – strong brand, skilled staff, patents, low costs.
- Weaknesses (internal, harmful): limitations that put the firm at a disadvantage – old technology, high debt, weak distribution.
- Opportunities (external, helpful): favourable conditions – new markets, government schemes, changing customer tastes.
- Threats (external, harmful): unfavourable conditions – new competitors, regulation, economic slowdown.
2. TOWS Matrix – Turning SWOT into Strategy
- SO strategies: use strengths to grab opportunities (growth).
- WO strategies: overcome weaknesses by using opportunities.
- ST strategies: use strengths to reduce threats.
- WT strategies: minimise weaknesses and avoid threats (defensive).
3. Example – SWOT of an Indian Dairy Co-operative
| Strengths | Weaknesses |
|---|---|
| Trusted brand, huge farmer network, wide distribution | Dependence on milk supply, thin margins, perishable products |
| Opportunities | Threats |
| Demand for protein and value-added dairy, exports, online grocery | Private competitors, plant-based milk, price controls, climate effects on fodder |
Advantages:
- Simple, quick and low-cost.
- Gives a clear overall picture.
- Basis for strategy choice (TOWS).
Limitations:
- Can be subjective.
- Lists factors without ranking them.
- Static – shows one point in time.
Memory aid: S and W are inside (controllable); O and T are outside (uncontrollable).
Q27. Explain PESTLE analysis with examples.
Introduction
The broad macro environment affects all firms in an economy. PESTLE analysis is a tool for scanning six groups of external factors – Political, Economic, Social, Technological, Legal and Environmental – to identify opportunities and threats.
1. Political Factors
Government stability, policies, taxation, trade restrictions, subsidies. Example: Production Linked Incentive (PLI) schemes encourage electronics manufacturing in India.
2. Economic Factors
GDP growth, inflation, interest rates, exchange rates, income levels, unemployment. Example: higher interest rates raise EMIs and reduce demand for cars and homes.
3. Social Factors
Population, age structure, lifestyle, education, culture, health consciousness. Example: a young, health-conscious population increases demand for fitness products.
4. Technological Factors
Innovation, automation, digitalisation, R&D, internet and mobile adoption. Example: UPI has transformed payments and enabled new fintech businesses.
5. Legal Factors
Laws on consumer protection, employment, competition, data protection, health and safety. Example: the Consumer Protection Act, 2019 brought e-commerce firms under stricter rules.
6. Environmental (Ecological) Factors
Climate change, pollution norms, waste management, sustainability expectations. Example: plastic bans push firms towards eco-friendly packaging.
Advantages:
- Gives a complete view of the macro environment.
- Highlights future risks and opportunities.
- Useful before entering a new market.
Limitations:
- Data can become outdated quickly.
- Factors may overlap (legal and political).
- Does not cover industry competition (needs Five Forces).
Comparison Table
| Factor | Example variables | Indian example |
|---|---|---|
| Political | Policies, subsidies | PLI schemes |
| Economic | Inflation, interest rates | Higher EMIs |
| Social | Lifestyle, demographics | Young population |
| Technological | Digital adoption | UPI payments |
| Legal | Consumer, labour laws | CPA 2019 |
| Environmental | Pollution, climate | Plastic ban |
Memory aid: PESTLE – "Please Ensure Strategy Takes Long-term Environment into account."
Q28. Explain organisational structure and its relationship with strategy.
Introduction
Organisational structure is the formal arrangement of roles, authority, responsibilities and reporting relationships in an organisation. Alfred Chandler (1962) studied large American firms and concluded that "structure follows strategy" – when strategy changes, structure must change to support it.
1. Types of Organisational Structure
- Simple (entrepreneurial) structure: the owner makes all decisions; suits small firms.
- Functional structure: grouped by functions – production, marketing, finance, HR. Suits single-product firms; gives specialisation but weak coordination.
- Divisional structure: separate divisions by product, geography or customer, each with its own functions. Suits diversified firms; gives focus but duplicates resources.
- Strategic Business Unit (SBU) structure: related divisions grouped into SBUs, each run like a separate business with its own strategy.
- Matrix structure: employees report to both a functional manager and a project/product manager. Suits complex projects; may cause confusion over two bosses.
- Network / virtual structure: a small core firm outsources most activities to partners. Flexible and low-cost.
Diagram loads when you reach it.
Diagram text
flowchart TD
    subgraph FN["Functional structure"]
        C1["CEO"] --> P1["Production"]
        C1 --> M1["Marketing"]
        C1 --> F1["Finance"]
    end
    subgraph DV["Divisional structure"]
        C2["CEO"] --> DA["Division A"]
        C2 --> DB["Division B"]
        C2 --> DC["Division C"]
        DA --> X["each division has its own<br/>Production, Marketing, Finance"]
    end
2. Analysing the Strategy–Structure Fit
- Growth and diversification → move from functional to divisional or SBU structure.
- Global expansion → geographic or global matrix structure.
- Innovation strategy → flat, flexible, team-based structure.
- Cost leadership → centralised, tightly controlled structure.
- Signs of poor fit: slow decisions, conflicts, duplication, poor coordination.
Advantages of the right structure:
- Clear authority and responsibility.
- Faster decisions and better coordination.
- Efficient use of resources.
Limitations / risks:
- Restructuring is costly and disruptive.
- Too rigid a structure blocks change.
Comparison Table
| Structure | Best for | Strength | Weakness |
|---|---|---|---|
| Functional | Single business | Specialisation | Poor coordination |
| Divisional | Diversified firm | Focus on products/markets | Duplication |
| SBU | Large conglomerate | Clear accountability | Extra management layer |
| Matrix | Complex projects | Flexibility | Two bosses |
| Network | Fast-changing industries | Low cost, flexible | Less control |
Example: As the Tata Group expanded into many industries, it operated through separate companies such as Tata Steel, TCS and Tata Motors – a divisional-type structure supporting a diversification strategy.
Q29. Explain marketing, financial and HR issues in strategic evaluation and control.
Introduction
Marketing connects the firm with its customers, so marketing issues directly affect sales, market share and brand strength. Strategic control must check whether marketing decisions support the overall strategy.
1. Key Marketing Issues
- Market segmentation and targeting: choosing the right customer groups.
- Positioning: building a clear image that supports the business strategy.
- Product decisions: product mix, new product development, product life cycle.
- Pricing: setting prices that fit cost leadership or differentiation.
- Distribution (place): channel choice – retail, online, omnichannel.
- Promotion: advertising, digital marketing, sales promotion, personal selling.
- Customer relationship and retention.
- Marketing research and information.
2. Control Measures for Marketing
- Sales volume and revenue against targets.
- Market share.
- Customer satisfaction and Net Promoter Score.
- Customer acquisition cost and retention rate.
- Advertising effectiveness (reach, conversions, return on ad spend).
- Marketing audit – a periodic, complete review of marketing environment, objectives and activities.
Comparison Table
| Issue | Strategic link | Control measure |
|---|---|---|
| Segmentation | Right target customers | Sales by segment |
| Pricing | Supports cost/differentiation | Price realisation, margin |
| Distribution | Market reach | Outlets covered, online share |
| Promotion | Awareness | Return on ad spend |
| Retention | Loyalty | Repeat-purchase rate |
Example: A smartphone brand tracks its online market share and customer ratings after each launch and changes its promotion if share falls.
Financial control: Check whether the strategy can be funded and creates acceptable returns without undermining liquidity. Review profitability, cash flow, working capital, debt exposure, investment appraisal and budget variances. Compare actual results with targets and investigate causes; a profit increase alongside worsening cash collection may signal a problem. Corrective actions may include revising budgets, collecting receivables, phasing investment or reconsidering financing.
Human-resource control: Check staffing levels, competencies, training, appraisal, incentives, retention and industrial relations. Measures include skill gaps, turnover, absenteeism, productivity and training outcomes. If a service strategy requires responsiveness but rewards only the number of calls handled, incentives may undermine quality. Adjust staffing, training and appraisal to support the strategy.
Integrated case: For an online retailer pursuing reliable delivery, marketing tracks repeat purchases and complaints, finance checks margins and cash flow, HR tracks delivery-team capacity and skills, and operations tracks late deliveries and defects (Q19). Review the measures together: cutting staffing cost may improve one ratio while damaging service and long-term retention.
Syllabus coverage checklist
Checked against the supplied MIM702A Strategic Management syllabus PDF on . This maps the listed content topics to answers; it is not a prediction of exam questions or marks for any individual answer.
| Module | Listed syllabus topics | Answers |
|---|---|---|
| M1 | Strategy and strategic management: meaning, features, scope and importance | Q1 |
| M1 | Mission, vision, goals and objectives | Q2 |
| M1 | Strategy levels; strategic decision making; management process | Q3–Q5 |
| M2 | Environmental scanning and internal/external environmental analysis | Q6 |
| M2 | SWOT and PESTLE | Q6, Q26–Q27 |
| M2 | Competition analysis, Five Forces, generic strategies and competitive advantage | Q6–Q8 |
| M2 | Value chain, McKinsey 7S, Balanced Scorecard and BCG matrix | Q9–Q12 |
| M3 | Implementation, organisational structure/analysis and strategy–structure fit | Q13, Q28 |
| M3 | Managing strategic change and implementation issues | Q13–Q14 |
| M3 | Behavioural issues, leadership and corporate culture | Q15 |
| M3 | Social responsibility and ethics | Q16 |
| M4 | Designing and implementing strategic control | Q17 |
| M4 | Types and techniques of evaluation/control | Q18, Q21 |
| M4 | Operational/production, marketing, financial and HR functional issues | Q19, Q29 |
| M4 | Environmental factors and information for strategic control | Q20 |
| M5 | Definition, introduction, overview and importance of business policy; policy/procedure/rule | Q22 |
| M5 | Types of policies | Q23 |
| M5 | Factors considered and essentials before framing policy | Q24 |
| M5 | Procedure, process and steps in policy formulation | Q25 |