Research Methodology
From a good question to a sound conclusion.
Before you start
Syllabus-checked revision — 32 questions with answers
The core set remains Q1–Q30. Additional answers Q31–Q32 below deepen the syllabus topics that needed more explanation. Expand the syllabus checklist at the end to locate each topic.
Based on the BCAC702 theory syllabus in sem723.pdf. Module marks: M1 15, M2 15, M3 20, M4 20, M5 15, M6 15. Keep the statistical worked examples; ANOVA needs conceptual understanding at the syllabus level.
How to use: Expand one question at a time. Smaller overlapping questions have been folded into the relevant answer. For a short answer, use the definition and key points; for a longer answer, add the explanation, diagram or worked example. These are syllabus-based study groups, not predictions of the exam paper.
Module 1: Foundations of Research — 15 marks
Q1. Define research and explain its objectives, motivation and types.
Introduction
Research can be classified in different ways depending on its purpose, method and the type of data used. Understanding these types helps a researcher choose the right approach for a problem. The main types of research are Basic, Applied, Exploratory and Descriptive research.
1. Basic (Pure / Fundamental) Research
Basic research is carried out to increase knowledge and develop theories, without any immediate practical use.
Features: theoretical, long-term, generalises findings.
Example: Developing a new theory of how people learn.
2. Applied Research
Applied research is carried out to solve a specific, practical problem faced by society, industry or an organisation.
Features: practical, immediate use, problem-oriented.
Example: Finding out why users uninstall a mobile app.
3. Exploratory Research
Exploratory research studies a new or unclear problem to gain insights and develop ideas or hypotheses for further study.
Features: flexible, informal, uses literature review, expert opinion and small surveys.
Example: An initial study of how students use AI chatbots for study.
4. Descriptive Research
Descriptive research describes the characteristics of a person, group or situation as it exists ("what is"), without changing anything.
Features: structured, uses surveys and observation, answers who, what, where, when and how.
Example: A survey of internet usage among college students.
5. Other Types (Brief)
- Analytical research: uses existing facts and data to critically evaluate a situation.
- Quantitative research: uses numerical data and statistics.
- Qualitative research: uses opinions, experiences and non-numerical data.
- Experimental research: controls variables to find cause and effect.
Comparison Table
| Type | Purpose | Nature | Example |
|---|---|---|---|
| Basic | Expand knowledge | Theoretical | Theory of learning |
| Applied | Solve a practical problem | Practical | Reasons for app uninstalls |
| Exploratory | Understand a new problem | Flexible | Students' use of AI chatbots |
| Descriptive | Describe "what is" | Structured | Internet usage survey |
Memory aid (main four): "BAED" – Basic, Applied, Exploratory, Descriptive.
Meaning, objectives and motivation: Research is systematic investigation to answer questions or generate and test knowledge. Objectives may describe a phenomenon, explore a problem, explain relationships or support practical decisions. Motivation includes curiosity, solving problems, improving practice and contributing knowledge.
Q2. Explain the research process and characteristics of good research.
Introduction
Research must be carried out in a planned and orderly way to produce reliable results. The research process is the sequence of steps followed from identifying a problem to reporting the findings. Each step depends on the previous one.
Diagram:
Diagram loads when you reach it.
Diagram text
flowchart TD
    A["1. Identify research problem"] --> B["2. Review of literature"]
    B --> C["3. Formulate objectives and hypotheses"]
    C --> D["4. Prepare research design"]
    D --> E["5. Determine sample design"]
    E --> F["6. Collect data"]
    F --> G["7. Analyse data"]
    G --> H["8. Test hypotheses"]
    H --> I["9. Interpret and draw conclusions"]
    I --> J["10. Prepare research report"]
Steps of the Research Process
- Identify the research problem: Select a clear, specific and researchable problem.
- Review the literature: Study earlier research to understand the topic and find research gaps.
- Formulate objectives and hypotheses: State what the study aims to achieve and the testable statements.
- Prepare the research design: Decide the overall plan – descriptive, experimental or analytical.
- Determine the sample design: Decide the population, sample size and sampling method.
- Collect data: Gather data through surveys, interviews, observation or secondary sources.
- Analyse data: Edit, code and tabulate data and apply statistical tools.
- Test hypotheses: Use tests such as the t-test or chi-square test to accept or reject hypotheses.
- Interpret and draw conclusions: Explain what the results mean in relation to the objectives.
- Prepare the research report: Present the study in a structured format with references.
Example: In a study on social media and academic performance, the researcher defines the problem, reviews 10 papers, forms hypotheses, surveys 120 students, applies correlation analysis and writes the report.
Memory aid: "People Love Our Daily Sweet Coffee And Tea In Rooms" – Problem, Literature, Objectives, Design, Sample, Collect, Analyse, Test, Interpret, Report.
Good research: State a clear problem, use an appropriate systematic design, collect relevant evidence, analyse it transparently, draw conclusions supported by the data, acknowledge limitations and follow ethical procedures.
Q3. Explain how to formulate a research problem, questions and objectives.
Introduction
The research problem is the starting point of every study. A research problem is a specific issue, gap or difficulty that a researcher wants to study and solve. A clearly defined problem guides the entire research process, while a vague problem leads to confusion and poor results.
1. Sources for Identifying a Research Problem
- Personal experience and observation: problems noticed in daily life or work.
- Literature review: gaps and "future work" suggestions in research papers.
- Practical problems: issues in industry, society or institutions.
- Discussion with experts: guidance from teachers and professionals.
- New technologies and trends: emerging areas such as AI and digital payments.
2. Steps in Defining a Research Problem
- State the problem in general terms: identify the broad area of interest.
- Understand the nature of the problem: discuss it with experts and people affected.
- Survey the available literature: see what has already been studied.
- Develop ideas through discussion: refine the problem with colleagues and guides.
- Rephrase the problem: convert it into a specific, clear and researchable statement.
3. Criteria for Selecting a Good Research Problem
- Interest: the researcher should be genuinely interested.
- Importance: the problem should be useful to society or the field.
- Feasibility: it can be completed with available time, cost and data.
- Novelty: it should add something new.
- Clarity: it should be clearly defined.
- Competence: the researcher should have the required skills.
Example: The broad area "online learning" is narrowed to the defined problem: "What factors affect the satisfaction of BCA students in Kolkata with online classes?"
Questions and objectives: Narrow a broad topic to a feasible, specific problem. A research question asks what will be investigated; an objective states what the study will do; a hypothesis predicts a testable relationship. Example: question—Is study time related to marks? Objective—Estimate that relationship. Hypothesis—Study time is positively associated with marks. Association alone does not establish causation.
Q4. What is a variable? Explain the types of variables in research.
Introduction
Research studies the relationships between different characteristics of people, objects or events. A variable is any characteristic or attribute that can take different values among people, objects or situations, such as age, income or marks. Identifying variables correctly is essential for forming hypotheses and analysing data.
1. Independent Variable
The independent variable is the cause; it is changed or controlled by the researcher to see its effect.
Example: Study hours in a study on marks.
2. Dependent Variable
The dependent variable is the effect; it changes because of the independent variable.
Example: Marks obtained by students.
3. Moderating Variable
A moderating variable changes the strength or direction of the relationship between the independent and dependent variables.
Example: Teaching quality may strengthen the effect of study hours on marks.
4. Intervening (Mediating) Variable
An intervening variable explains how the independent variable affects the dependent variable.
Example: Understanding of the subject links study hours to marks.
5. Extraneous (Control) Variable
An extraneous variable is an outside factor that may affect the result and is therefore kept constant or controlled.
Example: The health of the student.
Diagram:
Diagram loads when you reach it.
Diagram text
flowchart LR
    IV["Independent variable<br/>(Study hours)"] --> DV["Dependent variable<br/>(Marks)"]
    MV["Moderating variable<br/>(Teaching quality)"] -. "affects strength of the link" .-> DV
Other classification: variables can also be quantitative (age, income) or qualitative / categorical (gender, religion).
Summary Table
| Type | Role | Example |
|---|---|---|
| Independent | Cause | Study hours |
| Dependent | Effect | Marks |
| Moderating | Changes strength of relationship | Teaching quality |
| Intervening | Explains the link | Understanding of subject |
| Extraneous | Outside factor, controlled | Health |
Module 2: Literature Review and Design — 15 marks
Q5. Explain literature review, its sources and research-gap identification.
Introduction
No research starts from zero; every study builds on earlier work. A literature review is a critical survey and summary of previous research – books, journal articles, conference papers and reports – related to the research topic. It shows what is already known and what still needs to be studied.
1. Importance of Literature Review
- Understanding the topic: It gives background knowledge and key concepts of the subject.
- Identifying research gaps: It shows what has not yet been studied or needs further study.
- Avoiding duplication: It prevents repeating work that has already been done.
- Building the framework: It helps develop the theoretical and conceptual framework.
- Formulating hypotheses: Earlier findings suggest testable hypotheses.
- Choosing methods: It shows which research designs, tools and techniques others have used successfully.
- Comparing results: Findings can later be compared with earlier studies in the discussion.
2. Steps in Conducting a Literature Review
- Search relevant sources using keywords.
- Select studies related to the research problem.
- Read carefully and take notes.
- Organise the studies by themes.
- Critically evaluate strengths and weaknesses.
- Write the review with proper citations.
Example: Before studying social media and academic performance, a researcher reviews 10 papers and finds that most studies were done in metro cities, revealing a gap for small towns.
Sources and gap identification: Use relevant journals, conference papers, books, reports and academic databases. Compare methods, populations, findings and limitations, not just article summaries. A research gap is a meaningful unresolved question, inconsistency or underexplored setting. Explain why the gap matters and how the proposed study addresses it.
Q6. What is research design? Explain its types.
Introduction
Before collecting data, a researcher needs a clear plan. Research design is the blueprint or overall plan for conducting research. It specifies what data will be collected, from whom, how it will be collected, and how it will be analysed to answer the research questions.
1. Features of a Good Research Design
- Appropriate to the research problem and objectives.
- Flexible enough to handle unexpected situations.
- Efficient and economical in time and cost.
- Minimises bias and errors.
- Maximises reliability of results.
2. Types of Research Design
(a) Experimental Design
In experimental design, the researcher manipulates the independent variable and observes its effect on the dependent variable, while controlling other factors.
- Uses an experimental group (receives the treatment) and a control group (does not).
- Purpose: to establish cause and effect.
Example: One class is taught with videos and another without; their marks are compared.
(b) Descriptive Design
Descriptive design describes the characteristics of a population or situation as it is, without any manipulation.
- Uses surveys and observation.
- Answers what, who, where, when and how.
Example: A survey of smartphone usage among students.
(c) Analytical Design
Analytical design uses existing facts or data to analyse and evaluate a situation and explain why something happens.
Example: Analysing 10 years of sales data to explain a decline in sales.
Comparison of Research Designs
| Basis | Experimental | Descriptive | Analytical |
|---|---|---|---|
| Purpose | Cause and effect | Describe "what is" | Explain "why" using existing data |
| Variable control | Yes, manipulated | No | No |
| Main method | Experiments | Surveys, observation | Analysis of existing data |
| Example | Effect of a new teaching method | Survey of internet usage | Study of sales trend |
Q7. What is a hypothesis? Explain its types and characteristics of a good hypothesis.
Introduction
Research often begins with an educated guess about how variables are related. A hypothesis is a tentative statement or assumption about the relationship between two or more variables, which can be tested using data. It gives direction to data collection and analysis.
1. Types of Hypothesis
- Null hypothesis (H₀): States that there is no relationship or no difference between variables. Example: "There is no significant relationship between study hours and marks."
- Alternative hypothesis (H₁): States that a relationship or difference exists. Example: "There is a significant relationship between study hours and marks."
- Directional hypothesis: States the direction of the relationship. Example: "More study hours lead to higher marks."
- Non-directional hypothesis: States that a relationship exists without stating its direction. Example: "Study hours affect marks."
2. Characteristics of a Good Hypothesis
- Clear and precise: written in simple, unambiguous language.
- Testable: can be verified using available data and methods.
- States a relationship: clearly links the variables.
- Specific: limited in scope.
- Consistent: agrees with known facts and earlier literature.
- Simple: easy to understand.
3. Sources of Hypotheses
Literature review, existing theories, observation, personal experience and results of earlier research.
Example: For a study on social media, H₀: "Social media usage has no significant effect on students' SGPA"; H₁: "Social media usage has a significant effect on students' SGPA."
Q8. What is a conceptual framework? Explain with a diagram.
Definition: A conceptual framework is a diagram or written model that shows the key variables of a study and the expected relationships between them, based on the literature.
Key points:
- It shows independent variables, dependent variables and their links.
- It guides the formation of hypotheses.
- It shows clearly what the study will test.
Example (factors affecting student performance):
Diagram loads when you reach it.
Diagram text
flowchart LR
    subgraph IVs["Independent variables"]
        A["Study hours"]
        B["Attendance"]
        C["Social media usage"]
    end
    A --> D["Academic performance<br/>(dependent variable)"]
    B --> D
    C --> D
How to develop the framework: Start with the problem and literature; define each construct; identify proposed relationships; specify how variables will be measured; draw the links; derive testable hypotheses; and state relevant control variables and scope. Arrows represent proposed relationships, not proof of causation. For a study of study-hours and marks, prior attainment could be a control variable; the design must justify any causal claim.
Module 3: Sampling and Data Collection — 20 marks
Q9. Explain sampling foundations and probability sampling methods.
Introduction
Studying an entire population is often impossible, so researchers select a sample. In probability (random) sampling, every unit of the population has a known, non-zero chance of being selected. Because selection is random, the results can be generalised to the whole population with less bias.
1. Simple Random Sampling
Every unit has an equal chance of being selected.
Method: lottery method or random number tables / generators.
Example: Picking 50 roll numbers out of 500 by lottery.
2. Systematic Sampling
Every k-th unit is selected from a list after a random start.
Sampling interval: k = N / n (population size ÷ sample size).
Example: N = 500, n = 50, so k = 10. With a random start of 4, select 4, 14, 24, 34 and so on.
3. Stratified Sampling
The population is divided into homogeneous groups (strata), such as gender or year of study, and a random sample is drawn from each stratum, usually in proportion to its size.
Example: 300 boys and 200 girls; a 10% sample gives 30 boys + 20 girls.
4. Cluster Sampling
The population is divided into clusters (often by area), some clusters are randomly selected, and all units in the selected clusters are studied.
Example: Randomly choose 5 colleges out of 50 and survey all BCA students in those 5 colleges.
5. Multi-stage Sampling
Sampling is done in stages, moving from larger to smaller units.
Example: State → districts → colleges → students.
Diagram:
Diagram loads when you reach it.
Diagram text
flowchart TD
    subgraph ST["Stratified sampling"]
        P1["Population"] --> A["Stratum A"] & B["Stratum B"] & C["Stratum C"]
        A & B & C -- "random selection" --> S1["Some units from EACH stratum"]
    end
    subgraph CL["Cluster sampling"]
        P2["Population"] --> C1["C1"] & C2["C2"] & C3["C3"] & C4["C4"] & C5["C5"]
        C2 & C4 -- "clusters picked at random" --> S2["ALL units of C2 and C4"]
    end
Advantages of probability sampling:
- Less bias and more representative samples.
- Results can be generalised to the population.
- Sampling error can be estimated statistically.
Limitations:
- Needs a complete sampling frame.
- More time and cost than non-probability sampling.
Sampling foundations: Population is the full group of interest; a sample is the studied subset; a sampling frame is the operational list or source used for selection; sample size is the number selected. A census studies every unit but may cost more; a sample is cheaper and quicker but requires an appropriate design.
Stratified versus cluster sampling: Stratified sampling divides the population into strata and samples within each; cluster sampling selects groups, then studies all or some units within selected groups. Strata aim for similarity within strata; clusters ideally reflect population diversity.
Q10. Explain non-probability sampling and compare it with probability sampling.
Introduction
Sometimes a complete list of the population is not available, or the study needs quick results. In non-probability sampling, units are selected based on the researcher's judgement or convenience, so not every unit has a known chance of being selected. These methods are faster and cheaper but less representative.
1. Convenience Sampling
The researcher selects people who are easily available.
Example: Surveying friends in the college canteen.
Merits and demerits: quick and cheap, but often biased.
2. Purposive (Judgement) Sampling
The researcher selects units believed to be most suitable for the study, based on expert judgement.
Example: Interviewing only IT managers for a study on software practices.
3. Quota Sampling
The researcher fixes quotas for different groups and fills them by convenience.
Example: Interviewing 50 men and 50 women at a shopping mall.
4. Snowball Sampling
Existing respondents refer other respondents. It is used for hard-to-reach groups.
Example: Studying freelance app developers by asking each respondent to suggest others.
Advantages of non-probability sampling:
- Quick, simple and inexpensive.
- Useful for exploratory studies and pilot surveys.
- Useful when no sampling frame exists.
Limitations:
- High chance of bias.
- Results cannot be reliably generalised to the population.
- Sampling error cannot be measured.
Memory aid: "CPQS" – Convenience, Purposive, Quota, Snowball ("Cheap People Quickly Snowball").
Probability versus non-probability: Probability designs use random selection with known selection probabilities, supporting design-based inference. Non-probability designs use availability, judgement, quotas or networks; they can be useful but have stronger limitations for representativeness and generalisation.
Q11. Compare primary and secondary data and explain collection methods.
Introduction
Primary data is original data collected directly by the researcher for a specific study. The choice of method depends on the research objectives, the type of respondents, time and budget. The main methods are survey, observation, interview and questionnaire.
1. Survey Method
The survey method collects information from a large number of people, usually through a structured questionnaire (online or offline).
Merits: covers a large group, standardised responses, easy to analyse.
Demerits: low response rate, answers may be superficial.
2. Observation Method
The researcher watches and records behaviour as it happens, without asking questions.
- Participant observation: the researcher joins the group being studied.
- Non-participant observation: the researcher observes from outside.
Merits: records actual behaviour rather than what people claim.
Demerits: time-consuming, observer bias, cannot directly study feelings or opinions.
3. Interview Method
The researcher collects information through face-to-face, telephone or online conversation.
- Structured interview: fixed questions in a fixed order.
- Unstructured interview: flexible, open conversation.
- Semi-structured interview: a mix of both.
Merits: in-depth information, doubts can be clarified, high response rate.
Demerits: costly, time-consuming, interviewer bias.
4. Questionnaire Method
A set of written questions is given to respondents, who fill it in themselves (by post, email or Google Forms).
Merits: cheap, covers a wide area, respondents can answer freely at their own time.
Demerits: only for literate respondents, low response rate, no chance to clarify questions.
Comparison Table
| Method | Best for | Main drawback |
|---|---|---|
| Survey | Large groups | Low depth |
| Observation | Actual behaviour | Observer bias |
| Interview | In-depth views | Costly, time-consuming |
| Questionnaire | Wide, literate population | Low response rate |
Example: To study online shopping habits, a researcher sends a Google Form questionnaire to 200 students and interviews 10 of them in depth.
Primary versus secondary data: Primary data is collected for the current study, for example through interviews, surveys or observation. Secondary data already exists, for example published reports, records or datasets. Check relevance, definitions, dates, quality and permission before reuse.
Q12. Explain questionnaire design and distinguish questionnaires from schedules.
Introduction
A questionnaire is the most widely used tool for collecting primary data. A poorly designed questionnaire gives confusing or biased answers, while a well-designed one gives accurate and useful data. Questionnaire design therefore requires careful planning.
1. Steps in Questionnaire Design
- Decide the information needed based on the research objectives.
- Decide the method of administration – online, in person or by post.
- Choose the question types – open-ended or closed-ended.
- Word the questions carefully in simple language.
- Arrange the sequence – easy and general questions first, sensitive questions last.
- Design the layout with clear instructions.
- Pre-test (pilot test) the questionnaire on a small group and revise it.
2. Types of Questions
- Open-ended questions: respondents answer in their own words. Example: "What do you like about online classes?"
- Closed-ended (structured) questions: respondents choose from given options.
- Dichotomous: Yes / No.
- Multiple choice: choose one or more options.
- Likert scale: Strongly disagree (1) to Strongly agree (5).
- Rating / ranking: rate items or rank them in order.
Example of a Likert item: "Online classes are as effective as offline classes." ○1 Strongly disagree ○2 Disagree ○3 Neutral ○4 Agree ○5 Strongly agree
3. Qualities of a Good Questionnaire
- Short, simple and clear language.
- No leading questions ("Don't you agree that…?").
- No double-barrelled questions (two questions in one, such as "Is the course useful and easy?").
- No jargon or ambiguous words.
- Logical sequence with a short introduction and assurance of confidentiality.
- Pre-tested before final use.
Advantages of a well-designed questionnaire:
- Collects accurate, comparable data.
- Easy to code and analyse.
- Reduces respondent confusion and bias.
Memory aid: Good questions are "SCAN" – Short, Clear, Avoid bias, Not double-barrelled.
Questionnaire versus schedule: A questionnaire is usually completed by respondents; a schedule is filled by an interviewer/enumerator asking the questions. The latter can clarify questions but costs more and can introduce interviewer bias. Pilot either instrument and avoid leading, double-barrelled and ambiguous questions.
Module 4: Statistical Tools — 20 marks
Q13. Explain central tendency with a short ungrouped example.
Introduction
A large set of data is difficult to understand at a glance. A measure of central tendency is a single value that represents the centre of a dataset and summarises the whole data. The three main measures are the mean, median and mode.
1. Arithmetic Mean
The mean is the average of all values – the sum of values divided by the number of values.
Merits: uses all values, easy to calculate. Demerit: affected by extreme values.
2. Median
The median is the middle value when data is arranged in order.
Ungrouped: median = value at position (n + 1)/2.
Merit: not affected by extreme values (useful for income data). Demerit: does not use all values.
3. Mode
The mode is the value that occurs most frequently.
Merit: useful for categorical data (most popular brand). Demerit: may not exist or may not be unique.
Where L = lower limit of the median / modal class, N = total frequency, cf = cumulative frequency before the class, f = frequency of the class, h = class width, f₁ = modal class frequency, f₀ = preceding class frequency, f₂ = succeeding class frequency.
4. Empirical Relationship
For moderately skewed data: Mode = 3 Median − 2 Mean.
Comparison Table
| Measure | Definition | Best used when |
|---|---|---|
| Mean | Arithmetic average | No extreme values |
| Median | Middle value of ordered data | Data has outliers |
| Mode | Most frequent value | Categorical data |
Example: For the data 2, 4, 4, 5, 7, 9, 11: mean = 6, median = 5, mode = 4.
Quick ungrouped example: For 2, 4, 4, 5, 7, 9, 11: sum = 42 and n = 7, so mean = 6; the middle observation gives median = 5; the most frequent observation gives mode = 4.
Q14. Numerical: Find the mean, median and mode of the grouped data below.
Given:
| Marks | 0–10 | 10–20 | 20–30 | 30–40 | 40–50 |
|---|---|---|---|---|---|
| No. of students (f) | 3 | 7 | 12 | 5 | 3 |
To find: mean, median and mode.
Solution:
Step 1: Working table.
| Class | f | Mid-value x | f × x | Cumulative frequency |
|---|---|---|---|---|
| 0–10 | 3 | 5 | 15 | 3 |
| 10–20 | 7 | 15 | 105 | 10 |
| 20–30 | 12 | 25 | 300 | 22 |
| 30–40 | 5 | 35 | 175 | 27 |
| 40–50 | 3 | 45 | 135 | 30 |
| Total | N = 30 | Σfx = 730 |
Step 2: Mean = Σfx / N = 730 / 30 = 24.33
Step 3: Median. N/2 = 15, so the median class is 20–30 (first cf ≥ 15 is 22). L = 20, cf = 10, f = 12, h = 10.
Median = 20 + ((15 − 10) / 12) × 10 = 20 + 4.17 = 24.17
Step 4: Mode. Modal class = 20–30 (highest f = 12). f₁ = 12, f₀ = 7, f₂ = 5.
Mode = 20 + ((12 − 7) / (24 − 7 − 5)) × 10 = 20 + (5/12) × 10 = 24.17
Answer: Mean = 24.33, Median = 24.17, Mode = 24.17.
Q15. Explain the measures of dispersion.
Introduction
Two datasets can have the same average but very different spreads. For example, marks of 50, 50, 50 and 0, 50, 100 both have a mean of 50. Dispersion measures how much the values are spread out from the centre (average), showing the consistency or variability of data.
1. Range
Range = Largest value − Smallest value.
Feature: simplest measure, but uses only two values and is affected by extremes.
2. Quartile Deviation (QD)
QD = (Q₃ − Q₁) / 2.
Feature: measures the spread of the middle 50% of data; not affected by extreme values.
3. Mean Deviation (MD)
MD = Σ|x − mean| / n.
Feature: the average absolute distance of values from the mean.
4. Variance (σ²)
Variance = Σ(x − mean)² / n.
Feature: the average of squared deviations from the mean.
5. Standard Deviation (σ)
Feature: the most widely used measure; it is in the same unit as the data.
6. Coefficient of Variation (CV)
CV = (σ / mean) × 100.
Feature: a relative measure in percentage, used to compare the consistency of two datasets. Lower CV = more consistent.
Note: For a sample, divide by (n − 1) instead of n to get the unbiased sample variance (s²).
Summary Table
| Measure | Formula | Main use |
|---|---|---|
| Range | Largest − Smallest | Quick idea of spread |
| Quartile Deviation | (Q₃ − Q₁) / 2 | Spread of middle 50% |
| Mean Deviation | Σ|x − mean| / n | Average distance from mean |
| Variance | Σ(x − mean)² / n | Basis for SD |
| Standard Deviation | √Variance | Most common measure |
| Coefficient of Variation | (σ / mean) × 100 | Comparing consistency |
Example: For 5, 8, 10, 12, 15: range = 10, MD = 2.8, variance = 11.6, SD = 3.41, CV = 34.1%.
Memory aid: "Real Queens Make Very Strong Choices" – Range, QD, MD, Variance, SD, CV.
Q16. Numerical: Find range, mean deviation, variance, standard deviation and CV of 5, 8, 10, 12, 15.
Given: Data = 5, 8, 10, 12, 15 (n = 5).
To find: range, mean deviation, variance, SD and CV.
Solution:
Mean = (5 + 8 + 10 + 12 + 15) / 5 = 50 / 5 = 10
| x | x − mean | |x − mean| | (x − mean)² |
|---|---|---|---|
| 5 | −5 | 5 | 25 |
| 8 | −2 | 2 | 4 |
| 10 | 0 | 0 | 0 |
| 12 | 2 | 2 | 4 |
| 15 | 5 | 5 | 25 |
| Total | 0 | 14 | 58 |
- Range = 15 − 5 = 10
- Mean deviation = 14 / 5 = 2.8
- Variance (population) = 58 / 5 = 11.6
- Standard deviation = √11.6 = 3.41
- CV = (3.41 / 10) × 100 = 34.1%
(Sample variance = 58 / 4 = 14.5; sample SD = 3.81.)
Answer: Range = 10, MD = 2.8, Variance = 11.6, SD = 3.41, CV = 34.1%.
Q17. Calculate and interpret correlation and regression; distinguish their uses.
Given:
| X | 2 | 4 | 6 | 8 | 10 |
|---|---|---|---|---|---|
| Y | 3 | 7 | 5 | 10 | 12 |
To find: r, the regression lines of Y on X and X on Y, and Y when X = 12.
Formulae:
(x and y are deviations from the means.)
Solution:
Mean X = 30 / 5 = 6; Mean Y = 37 / 5 = 7.4
| X | Y | x = X − 6 | y = Y − 7.4 | xy | x² | y² |
|---|---|---|---|---|---|---|
| 2 | 3 | −4 | −4.4 | 17.6 | 16 | 19.36 |
| 4 | 7 | −2 | −0.4 | 0.8 | 4 | 0.16 |
| 6 | 5 | 0 | −2.4 | 0 | 0 | 5.76 |
| 8 | 10 | 2 | 2.6 | 5.2 | 4 | 6.76 |
| 10 | 12 | 4 | 4.6 | 18.4 | 16 | 21.16 |
| Total | 42 | 40 | 53.2 |
Step 1: Correlation coefficient.
r = 42 / √(40 × 53.2) = 42 / √2128 = 42 / 46.13 = 0.91 → strong positive correlation.
Step 2: Regression coefficients.
- b(yx) = 42 / 40 = 1.05
- b(xy) = 42 / 53.2 = 0.789
Step 3: Regression line of Y on X: Y − 7.4 = 1.05(X − 6) → Y = 1.05X + 1.1
Step 4: Regression line of X on Y: X − 6 = 0.789(Y − 7.4) → X = 0.789Y + 0.16
Check: r = √(1.05 × 0.789) = √0.829 = 0.91 ✓
Step 5: Prediction. If X = 12, Y = 1.05 × 12 + 1.1 = 13.7
Answer: r = 0.91 (strong positive); Y = 1.05X + 1.1; X = 0.789Y + 0.16; predicted Y at X = 12 is 13.7.
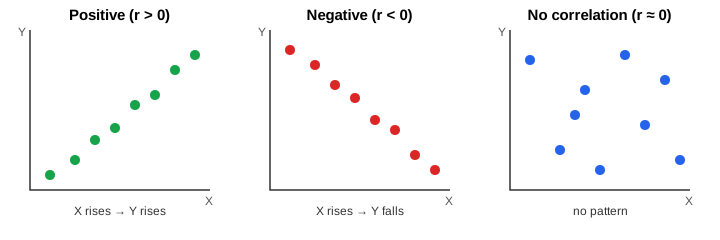
Correlation versus regression: Correlation measures association; regression models an outcome using one or more predictors and can support prediction. Correlation does not establish causation. The sign describes direction, and the strength must be interpreted with the plot, sample and context. Spearman's rank correlation is a rank-based alternative; for untied ranks, r_s = 1 − 6Σd²/[n(n²−1)].
Q18. Explain estimation of population parameters: point and interval estimation.
Introduction
In research, it is usually impossible to study the whole population, so values of the population (such as the average income of all Indians) are unknown. Estimation is the process of using sample statistics to estimate unknown population parameters.
| Population parameter | Sample statistic (estimator) |
|---|---|
| Mean (μ) | Sample mean (x̄) |
| Variance (σ²) | Sample variance (s²) |
| Proportion (P) | Sample proportion (p) |
1. Point Estimation
In point estimation, a single value calculated from the sample is used as the estimate of the population parameter.
Example: The average marks of a sample of 100 students = 60, so the estimated population mean = 60.
2. Interval Estimation
In interval estimation, a range of values (confidence interval) is given, within which the parameter is expected to lie with a stated level of confidence (such as 95%).
(Z = 1.96 for 95% confidence, 2.58 for 99% confidence.)
Example: n = 100, x̄ = 60, σ = 10. 95% CI = 60 ± 1.96 × (10 / √100) = 60 ± 1.96 = (58.04, 61.96).
3. Qualities of a Good Estimator
- Unbiased: its average value equals the true parameter (sample mean for μ; s² with divisor n − 1 for σ²).
- Consistent: it gets closer to the true value as sample size increases.
- Efficient: it has the smallest variance.
- Sufficient: it uses all the information in the sample.
Comparison
| Basis | Point estimate | Interval estimate |
|---|---|---|
| Form | One value | Range of values |
| Confidence level | Not stated | Stated (95%, 99%) |
| Example | Mean = 60 | 58.04 to 61.96 |
Conditions and interpretation: The displayed z-interval uses a known population standard deviation and a suitable sampling distribution for the mean. When the population standard deviation is unknown, an appropriate t-interval may be used under its assumptions. A 95% confidence procedure would cover the fixed population parameter in about 95% of repeated samples; it does not mean 95% of observations lie inside the interval. Check independence, sampling quality and distributional conditions.
Q19. What is hypothesis testing? Explain its steps. Define level of significance, p-value, Type I and Type II errors.
Introduction
Researchers often need to decide whether an observed difference or relationship is real or just due to chance. Hypothesis testing is a statistical procedure used to decide, on the basis of sample data, whether to reject or not reject the null hypothesis (H₀).
1. Steps of Hypothesis Testing
- State the hypotheses: H₀ (no difference / no relationship) and H₁ (difference or relationship exists).
- Choose the level of significance (α): usually 5% (0.05) or 1% (0.01).
- Select the appropriate test: t-test, chi-square test, ANOVA, etc.
- Compute the test statistic from the sample data.
- Find the critical (table) value or the p-value.
- Make a decision: reject H₀ when the statistic falls in the specified rejection region, or when p-value ≤ α; otherwise do not reject H₀. For a two-sided t-test, compare the absolute t statistic with the positive critical value. The correct rule depends on the test and alternative hypothesis.
- State the conclusion in plain words.
2. Key Terms
- Level of significance (α): the maximum probability of rejecting H₀ when it is actually true. At α = 0.05, the researcher accepts a 5% risk of this error.
- p-value: the probability of getting the observed result (or a more extreme one) if H₀ is true. A small p-value (< α) leads to rejecting H₀.
- Degrees of freedom (df): the number of values free to vary, such as n − 1.
3. Type I and Type II Errors
| Decision | H₀ is true | H₀ is false |
|---|---|---|
| Reject H₀ | Type I error (α) – false alarm | Correct decision |
| Do not reject H₀ | Correct decision | Type II error (β) – missed effect |
- Type I error: rejecting a true null hypothesis. Example: concluding a new teaching method works when it does not.
- Type II error: failing to reject a false null hypothesis. Example: failing to detect an effect that actually exists. A non-significant result is not proof of no effect.
Example: A researcher tests whether average marks differ from 50. With t = 1.58 and table value 2.262 at 5%, H₀ is not rejected.
Memory aid: "If p is low, H₀ must go."
Q20. Explain the t-test with a numerical example.
Introduction
When samples are small, the normal distribution cannot be used reliably. The t-test, developed by W. S. Gosset ("Student"), is used to test hypotheses about means when the sample size is small (n < 30) and the population standard deviation is unknown.
1. Types of t-test
- One-sample t-test: compares a sample mean with a known or claimed value.
- Two-sample (independent) t-test: compares the means of two independent groups, such as boys and girls.
- Paired t-test: compares the same group before and after a treatment, such as marks before and after training.
2. Formula (one-sample t-test)
3. Assumptions
- Data is approximately normally distributed.
- Observations are independent.
- Data is measured on an interval or ratio scale.
4. Numerical Example
Given: A college claims the average score is 50. A sample of 10 students has mean 52 and SD 4. Test at the 5% level.
Solution:
- H₀: μ = 50; H₁: μ ≠ 50
- α = 0.05, df = 10 − 1 = 9
- t = (52 − 50) / (4 / √10) = 2 / 1.265 = 1.58
- Table value of t at 5% (two-tailed), df = 9 = 2.262
- Since 1.58 < 2.262, do not reject H₀.
Answer: There is no significant difference; the college's claim of an average score of 50 is acceptable.
Advantages: suitable for small samples; simple to calculate.
Limitations: compares only one or two means; assumes normality.
Q21. Explain the chi-square test with a numerical example.
Introduction
Many research questions involve categorical data, such as gender, preference or opinion, rather than numerical scores. The chi-square (χ²) test is a non-parametric test used for categorical (frequency) data. It compares observed frequencies with expected frequencies.
1. Uses of the Chi-Square Test
- Test of independence: checks whether two attributes are related (gender and preference).
- Test of goodness of fit: checks whether observed data fits an expected distribution.
2. Formula
df = (rows − 1) × (columns − 1)
3. Numerical Example
Given: Is gender related to preference for online classes?
| Observed (O) | Prefer online | Prefer offline | Total |
|---|---|---|---|
| Male | 30 | 20 | 50 |
| Female | 10 | 40 | 50 |
| Total | 40 | 60 | 100 |
Solution:
- H₀: gender and preference are independent. H₁: they are related.
- Expected values: Male–Online = 50 × 40 / 100 = 20; Male–Offline = 30; Female–Online = 20; Female–Offline = 30.
- Calculate χ²:
| Cell | O | E | (O − E)² / E |
|---|---|---|---|
| Male–Online | 30 | 20 | 100/20 = 5.00 |
| Male–Offline | 20 | 30 | 100/30 = 3.33 |
| Female–Online | 10 | 20 | 100/20 = 5.00 |
| Female–Offline | 40 | 30 | 100/30 = 3.33 |
| χ² | 16.67 |
- df = (2 − 1)(2 − 1) = 1; table value at 5% = 3.841.
- Since 16.67 > 3.841, reject H₀.
Answer: Gender and preference for online classes are significantly related.
Advantages: works with categorical data; no normality assumption.
Limitations: expected frequency in each cell should usually be at least 5; shows association, not cause.
Q22. Explain ANOVA and compare it with the t-test and chi-square test.
Definition: ANOVA (Analysis of Variance) is a statistical test used to check whether the means of three or more groups are equal.
Key points:
- Hypotheses: H₀: all group means are equal (μ₁ = μ₂ = μ₃); H₁: at least one mean differs.
- Idea: it compares the variation between groups with the variation within groups.
- A large F value (greater than the table value) leads to rejecting H₀.
- One-way ANOVA studies one factor; two-way ANOVA studies two factors.
- ANOVA is preferred to many separate t-tests because repeated t-tests increase the chance of Type I error.
Example: Comparing the average marks of students taught by three different teaching methods.
Choosing among the syllabus tests: A t-test compares means under an appropriate design and assumptions; a chi-square test analyses categorical counts, such as goodness of fit or association; one-way ANOVA tests equality of group means through an F-ratio. A significant ANOVA indicates at least one mean differs, not which pairs differ. Match the test to the question, variable type, independence and distributional assumptions.
Basic assumptions: Standard independent-samples t-tests and one-way ANOVA require independent observations and appropriate distributional conditions; equal variances are required by their pooled/equal-variance versions. Paired t-tests analyse within-pair differences. Chi-square tests use categorical counts with adequate expected frequencies. State the design and assumptions before choosing the test.
Module 5: Analysis, Interpretation and Presentation — 15 marks
Q23. Explain coding, processing, classification and tabulation.
Introduction
Data collected through questionnaires and interviews is raw and cannot be analysed directly. Data processing is the set of operations that converts raw collected data into an organised form ready for statistical analysis.
Steps of Data Processing
- Editing: Checking completed questionnaires for errors, omissions and inconsistencies and correcting them. Example: an age written as 210 is corrected to 21 after checking with the respondent.
- Coding: Assigning numbers or symbols to answers so that they can be counted and analysed by computer. Example: Male = 1, Female = 2; Strongly agree = 5 … Strongly disagree = 1. All codes are recorded in a codebook.
- Classification: Grouping data into classes, such as by age group or gender.
- Tabulation: Arranging classified data in tables – simple tables (one variable) or cross tables (two or more variables).
- Data entry and analysis: Entering the coded data into software (Excel, SPSS) and applying statistical tools.
Diagram:
Diagram loads when you reach it.
Diagram text
flowchart LR
    A["Raw data"] --> B["Editing"] --> C["Coding"] --> D["Classification"] --> E["Tabulation"] --> F["Analysis"]
Advantages of proper data processing:
- Removes errors and makes data reliable.
- Makes data suitable for computer analysis.
- Saves time during analysis.
Example: In a survey of 120 students, incomplete forms are removed (editing), answers are converted to numbers (coding), and frequency tables of usage hours are prepared (tabulation).
Memory aid: "Every Child Can Talk Aloud" – Edit, Code, Classify, Tabulate, Analyse.
Classification and tabulation: Classification groups observations by characteristics; tabulation organises them in rows and columns. A useful table has a clear title, row/column labels, units, totals where meaningful and relevant source/notes. Coding assigns values or labels consistently before analysis.
Q24. Explain the use of charts, tables and graphs for data presentation.
Introduction
Large amounts of numerical data are hard to understand in raw form. Data presentation shows data in a form that is easy to understand, compare and interpret. Tables, charts and graphs are the main tools of data presentation in research reports.
1. Tables
Tables present exact values in rows and columns. They are best when many details must be shown, such as a frequency distribution.
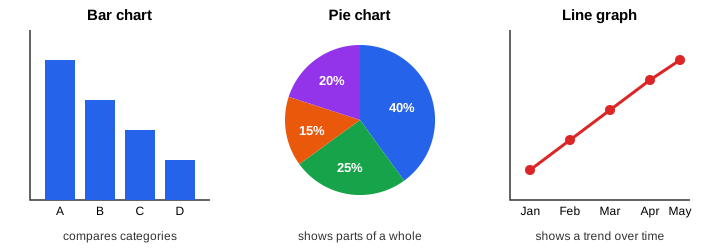
2. Bar Chart
A bar chart uses rectangular bars of equal width, with gaps between them, to compare categories. Example: number of students in each course.
3. Pie Chart
A pie chart shows parts of a whole as slices of a circle, in percentages. Example: share of mobile brands used by students.
4. Line Graph
A line graph joins data points with lines to show a trend over time. Example: monthly admissions over a year.
5. Histogram
A histogram shows the distribution of continuous data using adjacent bars without gaps. Example: distribution of marks.
6. Scatter Plot
A scatter plot shows the relationship between two variables using dots. Example: study hours versus marks.
Simple sketches for the exam:
Rules for good charts:
- A clear title.
- Labelled axes with units.
- A legend if there is more than one data series.
- A stated source.
- An honest scale (bars starting at zero).
Bar chart vs histogram: bars in a bar chart have gaps and represent categories; bars in a histogram touch and represent continuous class intervals.
Summary Table
| Chart / graph | Best used for | Example |
|---|---|---|
| Table | Exact values, many details | Frequency distribution |
| Bar chart | Comparing categories | Students in each course |
| Pie chart | Parts of a whole | Share of mobile brands |
| Line graph | Trend over time | Monthly admissions |
| Histogram | Distribution of continuous data | Distribution of marks |
| Scatter plot | Relationship between two variables | Study hours vs marks |
Q25. Explain interpretation, conclusions and recommendations.
Definition: Interpretation means explaining what the results mean in relation to the research objectives and hypotheses.
Guidelines:
- Relate results to the objectives and hypotheses (supported or not supported).
- Explain statistical results in plain words (r = 0.91 means a strong positive relationship).
- Compare findings with earlier studies from the literature review.
- Consider limitations such as sample size and sampling method.
- Avoid over-generalisation and do not confuse correlation with causation.
Example: "Since χ² = 16.67 > 3.841, H₀ is rejected. This means gender is significantly related to preference for online classes: male students prefer online classes more."
Conclusions and recommendations: Return to the research objectives, explain what the results support, state limitations and avoid claims beyond the data. Recommendations should follow from findings and be feasible. Distinguish statistical significance from practical importance and association from causation.
Q26. Give an overview of software tools used for data analysis.
Definition: Software tools for data analysis are computer programs used to organise, analyse and present research data quickly and accurately.
Main tools:
- MS Excel: data entry, descriptive statistics, charts and basic tests (Data Analysis ToolPak).
- SPSS: menu-based statistical package for descriptive statistics, t-test, chi-square, ANOVA, correlation and regression.
- R: open-source statistical programming language for advanced statistics and graphs.
- Python (Pandas, NumPy, SciPy, Matplotlib): data cleaning, analysis and visualisation.
- Google Forms / Sheets: online data collection and simple summaries.
Advantages: speed, accuracy, ability to handle large data, ready-made graphs and statistical tests.
Example: A student collects responses through Google Forms, cleans them in Excel and runs a chi-square test in SPSS.
Module 6: Reporting and Ethics — 15 marks
Q27. Explain report structure and how to write its main sections.
Introduction
Research is complete only when its findings are communicated to others. A research report is a formal written document that presents the research problem, methodology, findings and conclusions of a study in a structured way.
Structure of a Research Report
| Part | Contents |
|---|---|
| A. Preliminary pages | Title page, Declaration, Certificate, Acknowledgement, Table of contents, List of tables and figures, Abstract |
| B. Main text | 1. Introduction · 2. Literature review · 3. Research methodology · 4. Data analysis and results · 5. Discussion · 6. Conclusion and recommendations |
| C. End matter | References, Appendices (questionnaire, raw data) |
1. Preliminary Pages
Title page, declaration, certificate, acknowledgement, table of contents, list of tables and figures, and the abstract.
2. Main Text
- Introduction: background, problem, objectives and hypotheses.
- Literature review: summary of earlier studies and the research gap.
- Research methodology: design, sample, data collection tools and analysis methods.
- Data analysis and results: tables, charts and test results.
- Discussion: interpretation and comparison with earlier studies.
- Conclusion and recommendations: main findings, suggestions and future scope.
3. End Matter
References and appendices (questionnaire, raw data, additional tables).
Research paper format: a journal article follows the shorter IMRaD structure – Introduction, Methods, Results and Discussion – plus Abstract, Conclusion and References.
Qualities of a good report: clear and concise language, logical structure, accurate data, objective tone, proper citations and neat presentation of tables and figures.
Example: A BCA final-year project report on social media usage follows this structure, with the questionnaire placed in the appendix.
Writing the sections: Abstract—question, approach, main findings and conclusion. Introduction—context, gap and objectives. Methodology—design, sample, measures, procedure and analysis. Results—findings with relevant tables/figures. Discussion/conclusion—meaning, limitations, implications and next steps. Keep methods and findings reproducible and avoid unsupported conclusions.
Q28. Explain referencing styles: APA, MLA and IEEE.
Introduction
Researchers use the work of others and must acknowledge it. Referencing (citation) means acknowledging the sources used in research. It gives credit to the original authors, helps avoid plagiarism and allows readers to find the sources. Different fields use different referencing styles; the most common are APA, MLA and IEEE.
1. APA Style (American Psychological Association)
Used in: social sciences, management and education.
In-text citation: author–date, such as (Kothari, 2004).
Reference list: arranged alphabetically by author.
Example: Kothari, C. R. (2004). Research methodology: Methods and techniques. New Age International.
2. MLA Style (Modern Language Association)
Used in: humanities, languages and literature.
In-text citation: author–page, such as (Kothari 45).
Reference list: called "Works Cited", arranged alphabetically.
Example: Kothari, C. R. Research Methodology: Methods and Techniques. New Age International, 2004.
3. IEEE Style (Institute of Electrical and Electronics Engineers)
Used in: engineering, computer science and IT.
In-text citation: a number in square brackets, such as [1].
Reference list: numbered in the order the sources are first cited.
Example: [1] C. R. Kothari, Research Methodology: Methods and Techniques. New Delhi, India: New Age International, 2004.
Comparison Table
| Style | Used in | In-text citation | Reference list order |
|---|---|---|---|
| APA | Social sciences, management | (Kothari, 2004) | Alphabetical |
| MLA | Humanities, literature | (Kothari 45) | Alphabetical ("Works Cited") |
| IEEE | Engineering, computer science | [1] | Order of citation |
Memory aid: APA = Author + Year; MLA = Author + Page; IEEE = [Number].
Q29. Explain research ethics, plagiarism prevention and responsible data handling.
Introduction
Research often involves people and their personal information, and its findings influence decisions. Research ethics are the moral principles that guide researchers to conduct research honestly and responsibly, protecting participants and maintaining public trust in research.
1. Key Ethical Principles
- Informed consent: Participants agree to take part voluntarily after understanding the purpose of the study.
- Confidentiality and privacy: Personal data is protected and not disclosed to others.
- Anonymity: Respondents' identities are not revealed in the report.
- Voluntary participation: Participants are free to withdraw at any time.
- No harm: Participants must not suffer physical or mental harm.
- Honesty: No fabrication (making up data), falsification (changing data) or plagiarism.
- Objectivity: Bias is avoided in design, analysis and reporting.
- Proper acknowledgement: All sources and contributors are credited.
2. Responsible Data Handling
- Store data securely (password-protected files).
- Use data only for the stated purpose.
- Keep raw data for verification.
- Report results truthfully, including negative results.
3. Research Misconduct
The three most serious forms of misconduct are fabrication, falsification and plagiarism (FFP).
Example: In a student survey, the researcher explains the purpose at the start of the Google Form, does not collect names, and stores responses in a password-protected file.
Memory aid: "FFP" – Fabrication, Falsification, Plagiarism.
Plagiarism prevention: Attribute others' words, ideas, data and figures. Quote exact wording and cite it; paraphrase in your own structure while still citing the source. Keep accurate references, follow collaboration rules and report data honestly. A similarity score alone cannot establish whether work is ethical.
Q30. Explain research proposals and presentation preparation.
Introduction
Before starting a research project, a researcher usually needs approval from a guide, university or funding agency. A research proposal is a written plan of a proposed study, submitted for approval or funding before the research begins. It explains what will be studied, why, and how.
Contents of a Research Proposal
- Title: a clear and specific title of the study.
- Introduction / background: context of the problem.
- Statement of the problem: the specific issue to be studied.
- Objectives: what the study aims to achieve.
- Research questions / hypotheses: questions to be answered or statements to be tested.
- Brief literature review: summary of earlier studies and the research gap.
- Research methodology: design, sample, data collection tools and analysis methods.
- Scope and limitations: what the study will and will not cover.
- Significance: why the study is important.
- Time schedule: a work plan with deadlines.
- Budget: estimated cost (if funding is needed).
- References: sources cited.
Research Proposal vs Research Report
| Basis | Proposal | Report |
|---|---|---|
| Time | Before research | After research |
| Tense | Future ("will collect") | Past ("collected") |
| Contains results? | No | Yes |
| Purpose | Approval / funding | Present findings |
Example: A BCA student submits a proposal titled "Impact of social media on academic performance of BCA students" to the project guide before starting data collection.
Presentation: Present the problem, objectives, method, principal findings or expected contribution, limitations and conclusion in a clear sequence. Use readable figures, cite sources, rehearse timing and prepare to explain methodological choices.
Additional answers for syllabus depth
These expand topics that were too brief in the condensed set. Existing question numbers are unchanged.
Q31. Explain literature sources and demonstrate how to identify a defensible research gap.
Definition: Sources of literature are the places from which a researcher collects published information related to the research topic.
Main sources:
- Journals: research articles, often peer reviewed; assess quality and relevance rather than assuming every article is reliable (IEEE Transactions, Springer journals).
- Conference papers: latest research presented at conferences (ACM and IEEE proceedings).
- Reports: government, industry and organisational reports (NASSCOM reports, census reports).
- Books: basic concepts and theories (Kothari's Research Methodology).
- Theses and dissertations: detailed research by PhD and master's students (Shodhganga for Indian theses).
- Online databases: databases, digital libraries and search services (for example, IEEE Xplore, SpringerLink, ACM Digital Library and Google Scholar).
Primary literature = original research (journals, conference papers, theses). Secondary literature = summaries and reviews (textbooks, review articles).
Example: A student searches Google Scholar for "social media academic performance" and downloads five journal articles for the review.
From sources to a research gap:
- Specify the topic, population and key concepts; choose keywords and synonyms.
- Search more than one suitable source and record search terms and selection criteria.
- Build a review matrix: author/year, question, context, method, sample, finding and limitation.
- Compare studies for inconsistent findings, untested explanations, weak measurement, missing populations or changing circumstances.
- Explain why the unresolved issue matters and whether a feasible study could address it.
- Turn the gap into a question and objectives; avoid claiming “no research exists” after a small search.
Example: Suppose several studies associate social-media time with marks but use total screen time and do not distinguish academic from recreational use. A justified question is whether these uses have different associations with academic performance. Simply choosing another college is not automatically a meaningful research gap.
Q32. How do you write the main sections: abstract, introduction, methodology, results and conclusion?
Introduction
Each section of a research report or paper has a specific purpose. Writing each section correctly makes the report clear, complete and convincing.
1. Abstract
A concise summary covering the problem, objectives, method, key results and conclusion. Draft it after the main report. Follow the required word limit and format; citations and tables are usually avoided unless the prescribed style permits them.
2. Introduction
Presents the background, problem statement, objectives, research questions or hypotheses, and significance of the study. It moves from general to specific.
3. Methodology
Describes the research design, population and sample, sampling method, data collection tools and statistical tools. It should give enough detail for others to repeat the study.
4. Results
Presents the findings using tables, charts and statistical test results. It reports facts only, without personal opinions.
5. Discussion
Explains the meaning of the results, compares them with earlier studies, links them back to the hypotheses and mentions limitations.
6. Conclusion
Summarises the main findings and gives recommendations and future scope. No new data is introduced.
Summary Table
| Section | What to write | Tip |
|---|---|---|
| Abstract | Summary of problem, method, results, conclusion | Write it last |
| Introduction | Background, problem, objectives, hypotheses | General to specific |
| Methodology | Design, sample, tools, analysis | Enough detail to repeat |
| Results | Tables, charts, test results | Facts only |
| Discussion | Meaning, comparison, limitations | Link to hypotheses |
| Conclusion | Findings, recommendations, future scope | No new data |
Memory aid: "A IMRD C" – Abstract, Introduction, Methodology, Results, Discussion, Conclusion.
Illustrative abstract structure, without invented results: “This study examines [question] among [population]. A [design] using [sample and collection method] was analysed with [technique]. The principal finding was [actual result]. The evidence suggests [bounded conclusion], subject to [key limitation].” Replace brackets only with the study's real details.
Presentation checklist: Explain the problem and objectives, show the method briefly, present only the most relevant evidence, state limitations, and finish with supported conclusions. Use labelled visuals and readable text; cite borrowed material and rehearse to the allotted time. A proposal presentation uses planned methods and expected contributions, not invented results.
Syllabus coverage checklist
Checked against the supplied sem723.pdf theory syllabus on . This maps the listed content topics to answers; it is not a prediction of exam questions or marks for any individual answer.
| Module | Listed syllabus topics | Answers |
|---|---|---|
| M1 | Meaning, objectives, motivation and research types | Q1 |
| M1 | Research process and good-research characteristics | Q2 |
| M1 | Identifying/defining problems; questions and objectives | Q3 |
| M1 | Variables in research | Q4 |
| M2 | Literature-review importance and sources: journals, conferences, reports and databases | Q5, Q31 |
| M2 | Research-gap identification | Q5, Q31 |
| M2 | Experimental, descriptive and analytical research designs | Q6 |
| M2 | Hypotheses and development of conceptual framework | Q7–Q8 |
| M3 | Census versus sampling; probability/non-probability sampling | Q9–Q10 |
| M3 | Primary/secondary data; surveys, observation and interviews | Q11 |
| M3 | Questionnaires and schedules: differences and design | Q12 |
| M4 | Classification and tabulation | Q23 |
| M4 | Central tendency and dispersion, with worked examples | Q13–Q16 |
| M4 | Correlation and regression basics | Q17 |
| M4 | Population-parameter estimation | Q18 |
| M4 | Hypothesis testing; t-test, chi-square and ANOVA concept | Q19–Q22 |
| M5 | Data coding and processing | Q23 |
| M5 | Tables, charts and graphs | Q24 |
| M5 | Interpretation, conclusions and recommendations | Q25 |
| M5 | Analysis software overview | Q26 |
| M6 | Report/thesis/paper structure; abstract, introduction, methods, results and conclusion | Q27, Q32 |
| M6 | APA, MLA and IEEE referencing | Q28 |
| M6 | Plagiarism, ethics and responsible handling | Q29 |
| M6 | Proposal and presentation preparation | Q30, Q32 |